Introduction
Tumor Immune Single-cell Hub 2 (TISCH2) is a scRNA-seq database, which aims to characterize tumor microenvironment at single-cell resolution.
Data collection and processing
We collected tumor-related scRNA-seq studies from human and mouse. Besides datasets of treatment-naive patients, those with samples treated are also included. For each collected dataset, a uniform analysis pipeline -- MAESTRO was adopted to perform quality control, clustering and cell-type annotation (Fig. 1). After the streamlined processing, we curated the cell-type annotation of all datasets at three levels: malignancy, major-lineage and minor-lineage (Fig. 2). The curation makes the gene expression in different cell types comparable across all datasets.
Fig. 1 Workflow of TISCH2
Currently, after quality control, a total of 6,297,320 cells from 190 datasets across 50 cancer types and 101,195 cells from 3 PBMC datasets are retained in TISCH2 (Fig. 3).
Function of TISCH2
Based on the unified data processing, TISCH2 presents the analysis results in a user-friendly interface for public accessing, which allows researchers to gain a quick insight into the expression of genes of interest at the single-cell level (Fig. 1).
Usage
Starting from a cancer type
If users are interested in one cancer type, they can click the tissue card in home page to query the related datasets.
In the dataset page, users can further filter the query results according to other criteria. For example, users may be interested BRCA data from human patients without treatment.
The datasets satisfying the conditions will be displayed as below.
Multiple-dataset comparison
Users can select multiple datasets and click the Submit button to take a quick look at the selected datasets at the same time. Then users can input genes of interest to compare the gene expression across datasets. Besides, users can explore the expression pattern of a gene signature by uploading a line-separated gene list file. The level of cell-type annotation could be switched.
If users are interested one specific dataset, users can click the left annotated UMAP plot to achieve a comprehensive understanding of it. The page will be re-directed to the single-dataset page.
Single-dataset exploration
In the overview tab of single-dataset page, the clustering and annotation result are displayed on the top. And the top differentially expressed genes for each cluster are shown below. As in the multiple-dataset page, the annotation of cells can be chosen from three levels of cell-type annotation as well as meta information from original study (if available).
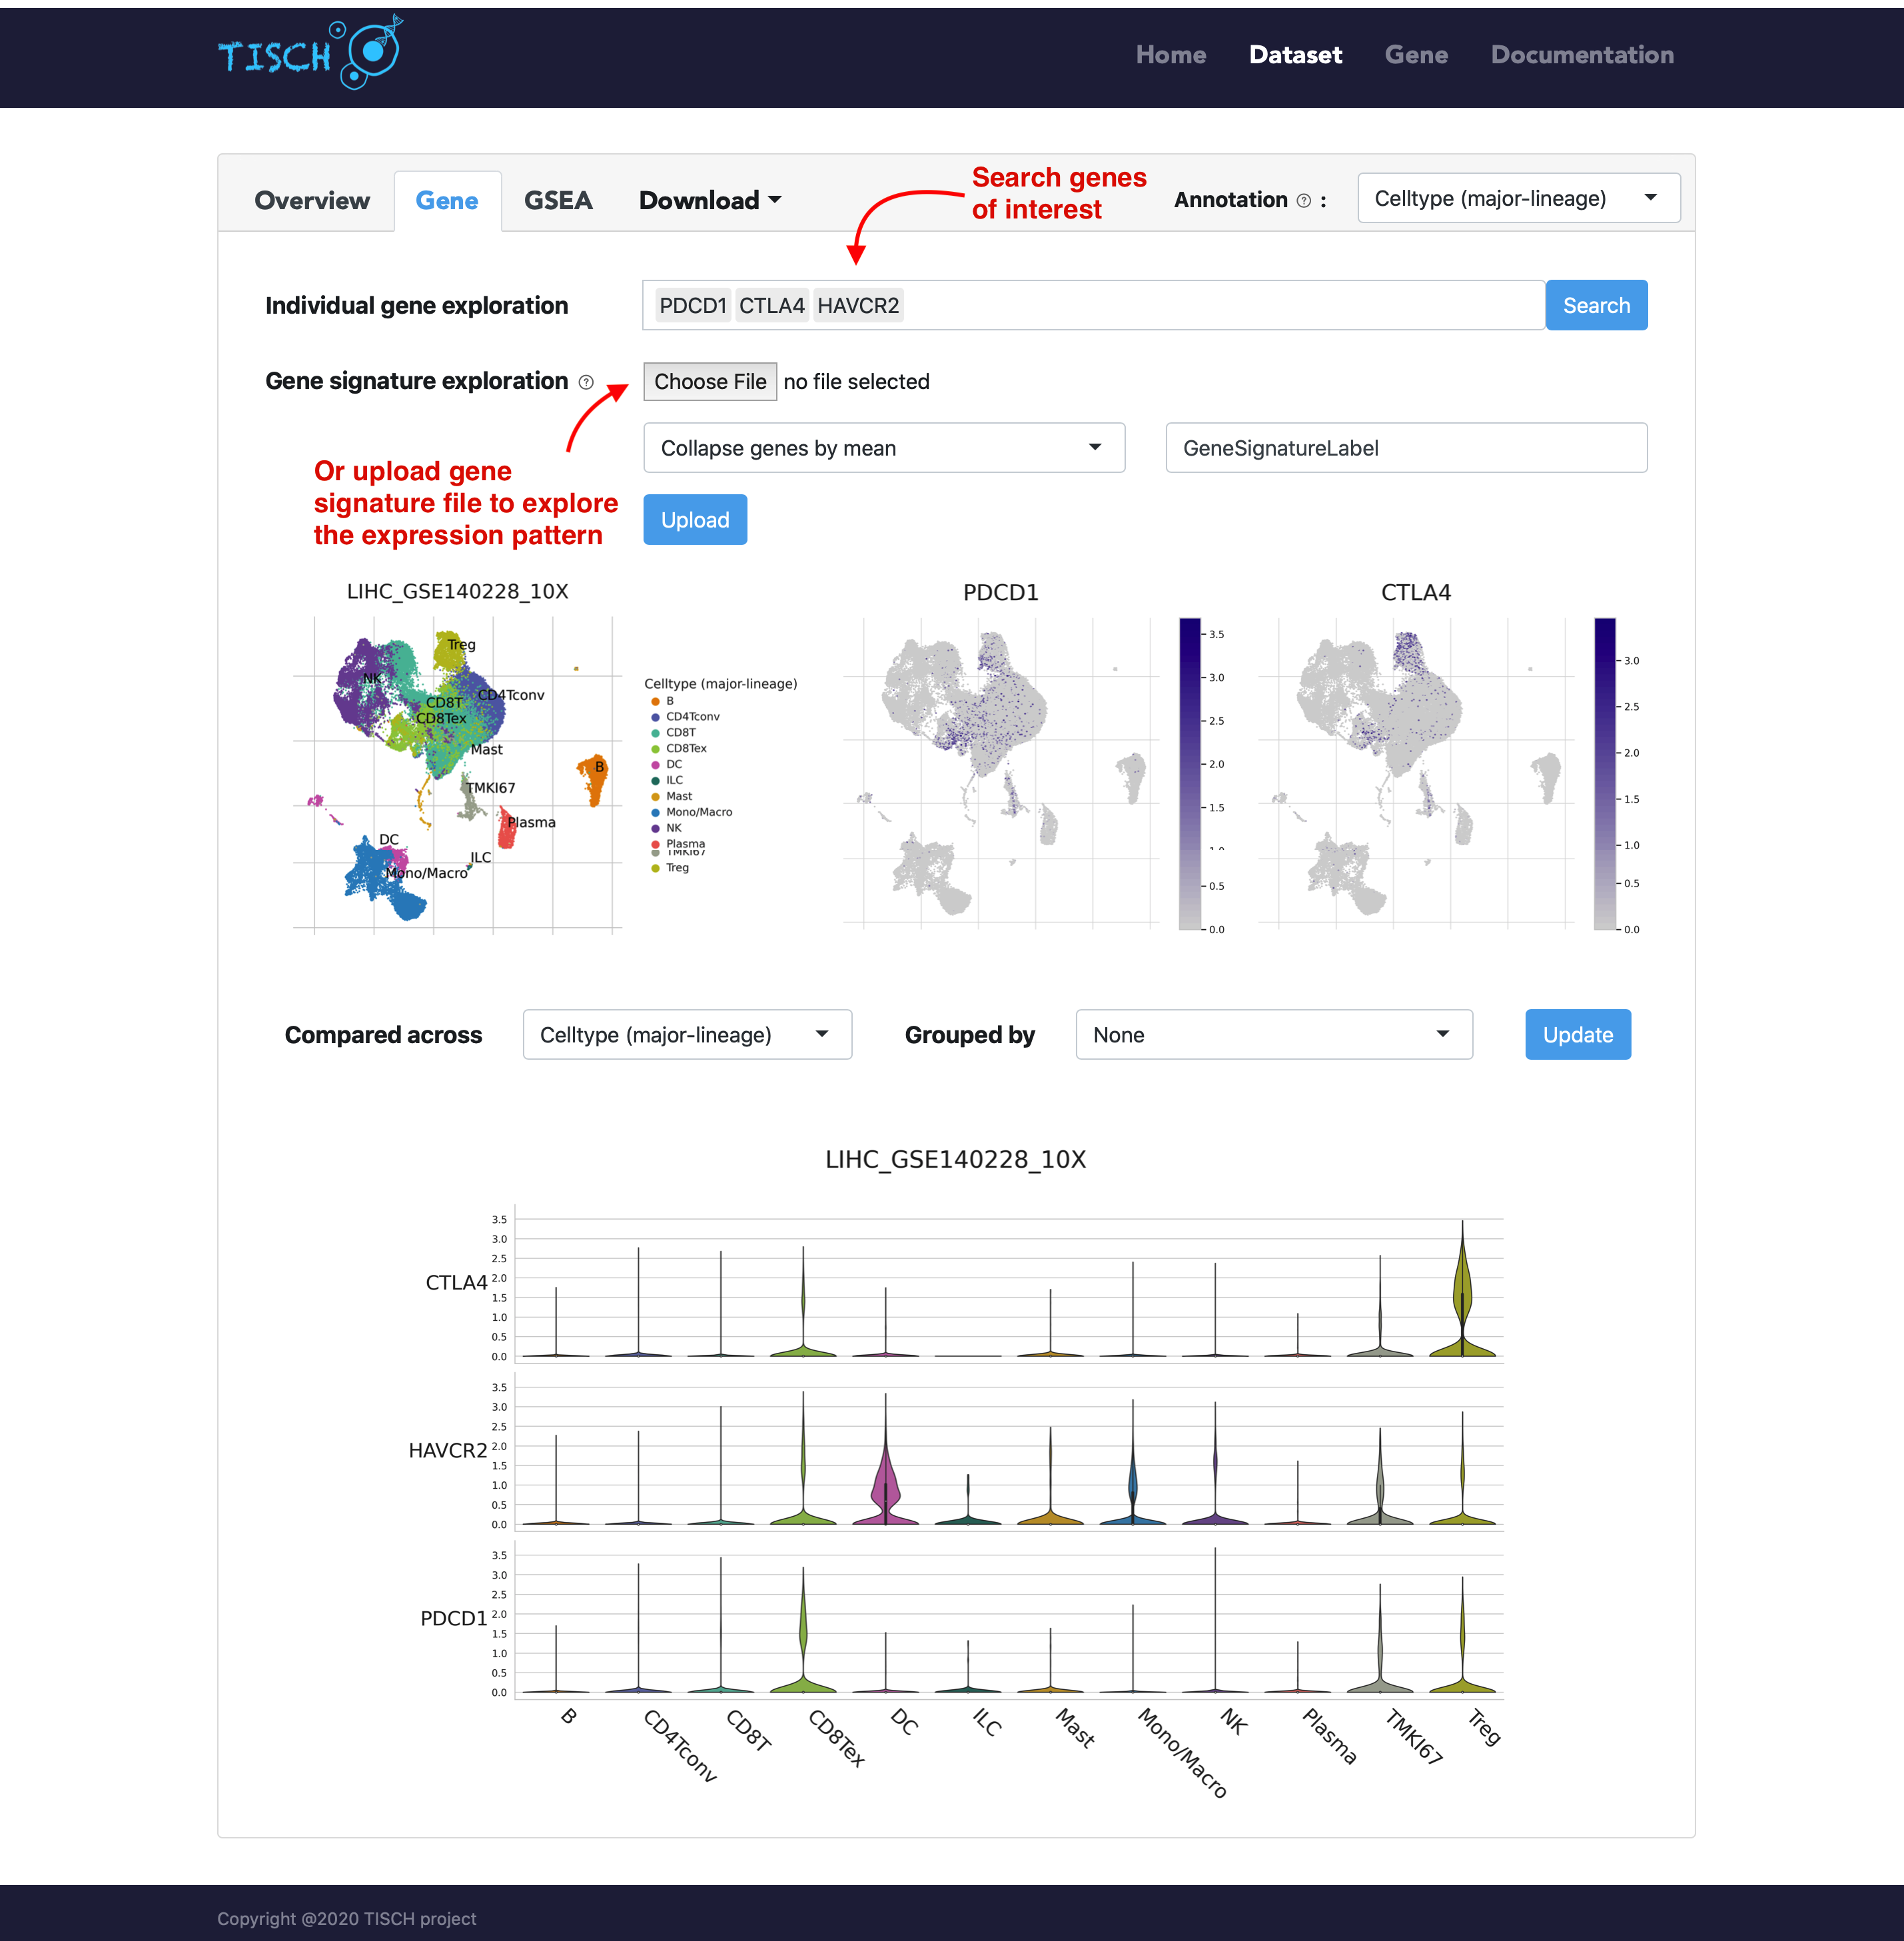
In the gene tab, users can search genes of interest. Besides the UMAP plots, a violin plot will be returned to show the gene expression in different cell types. As in the multiple-dataset page, users can explore the expresion pattern of a gene signature by uploading a line-separated gene list file.
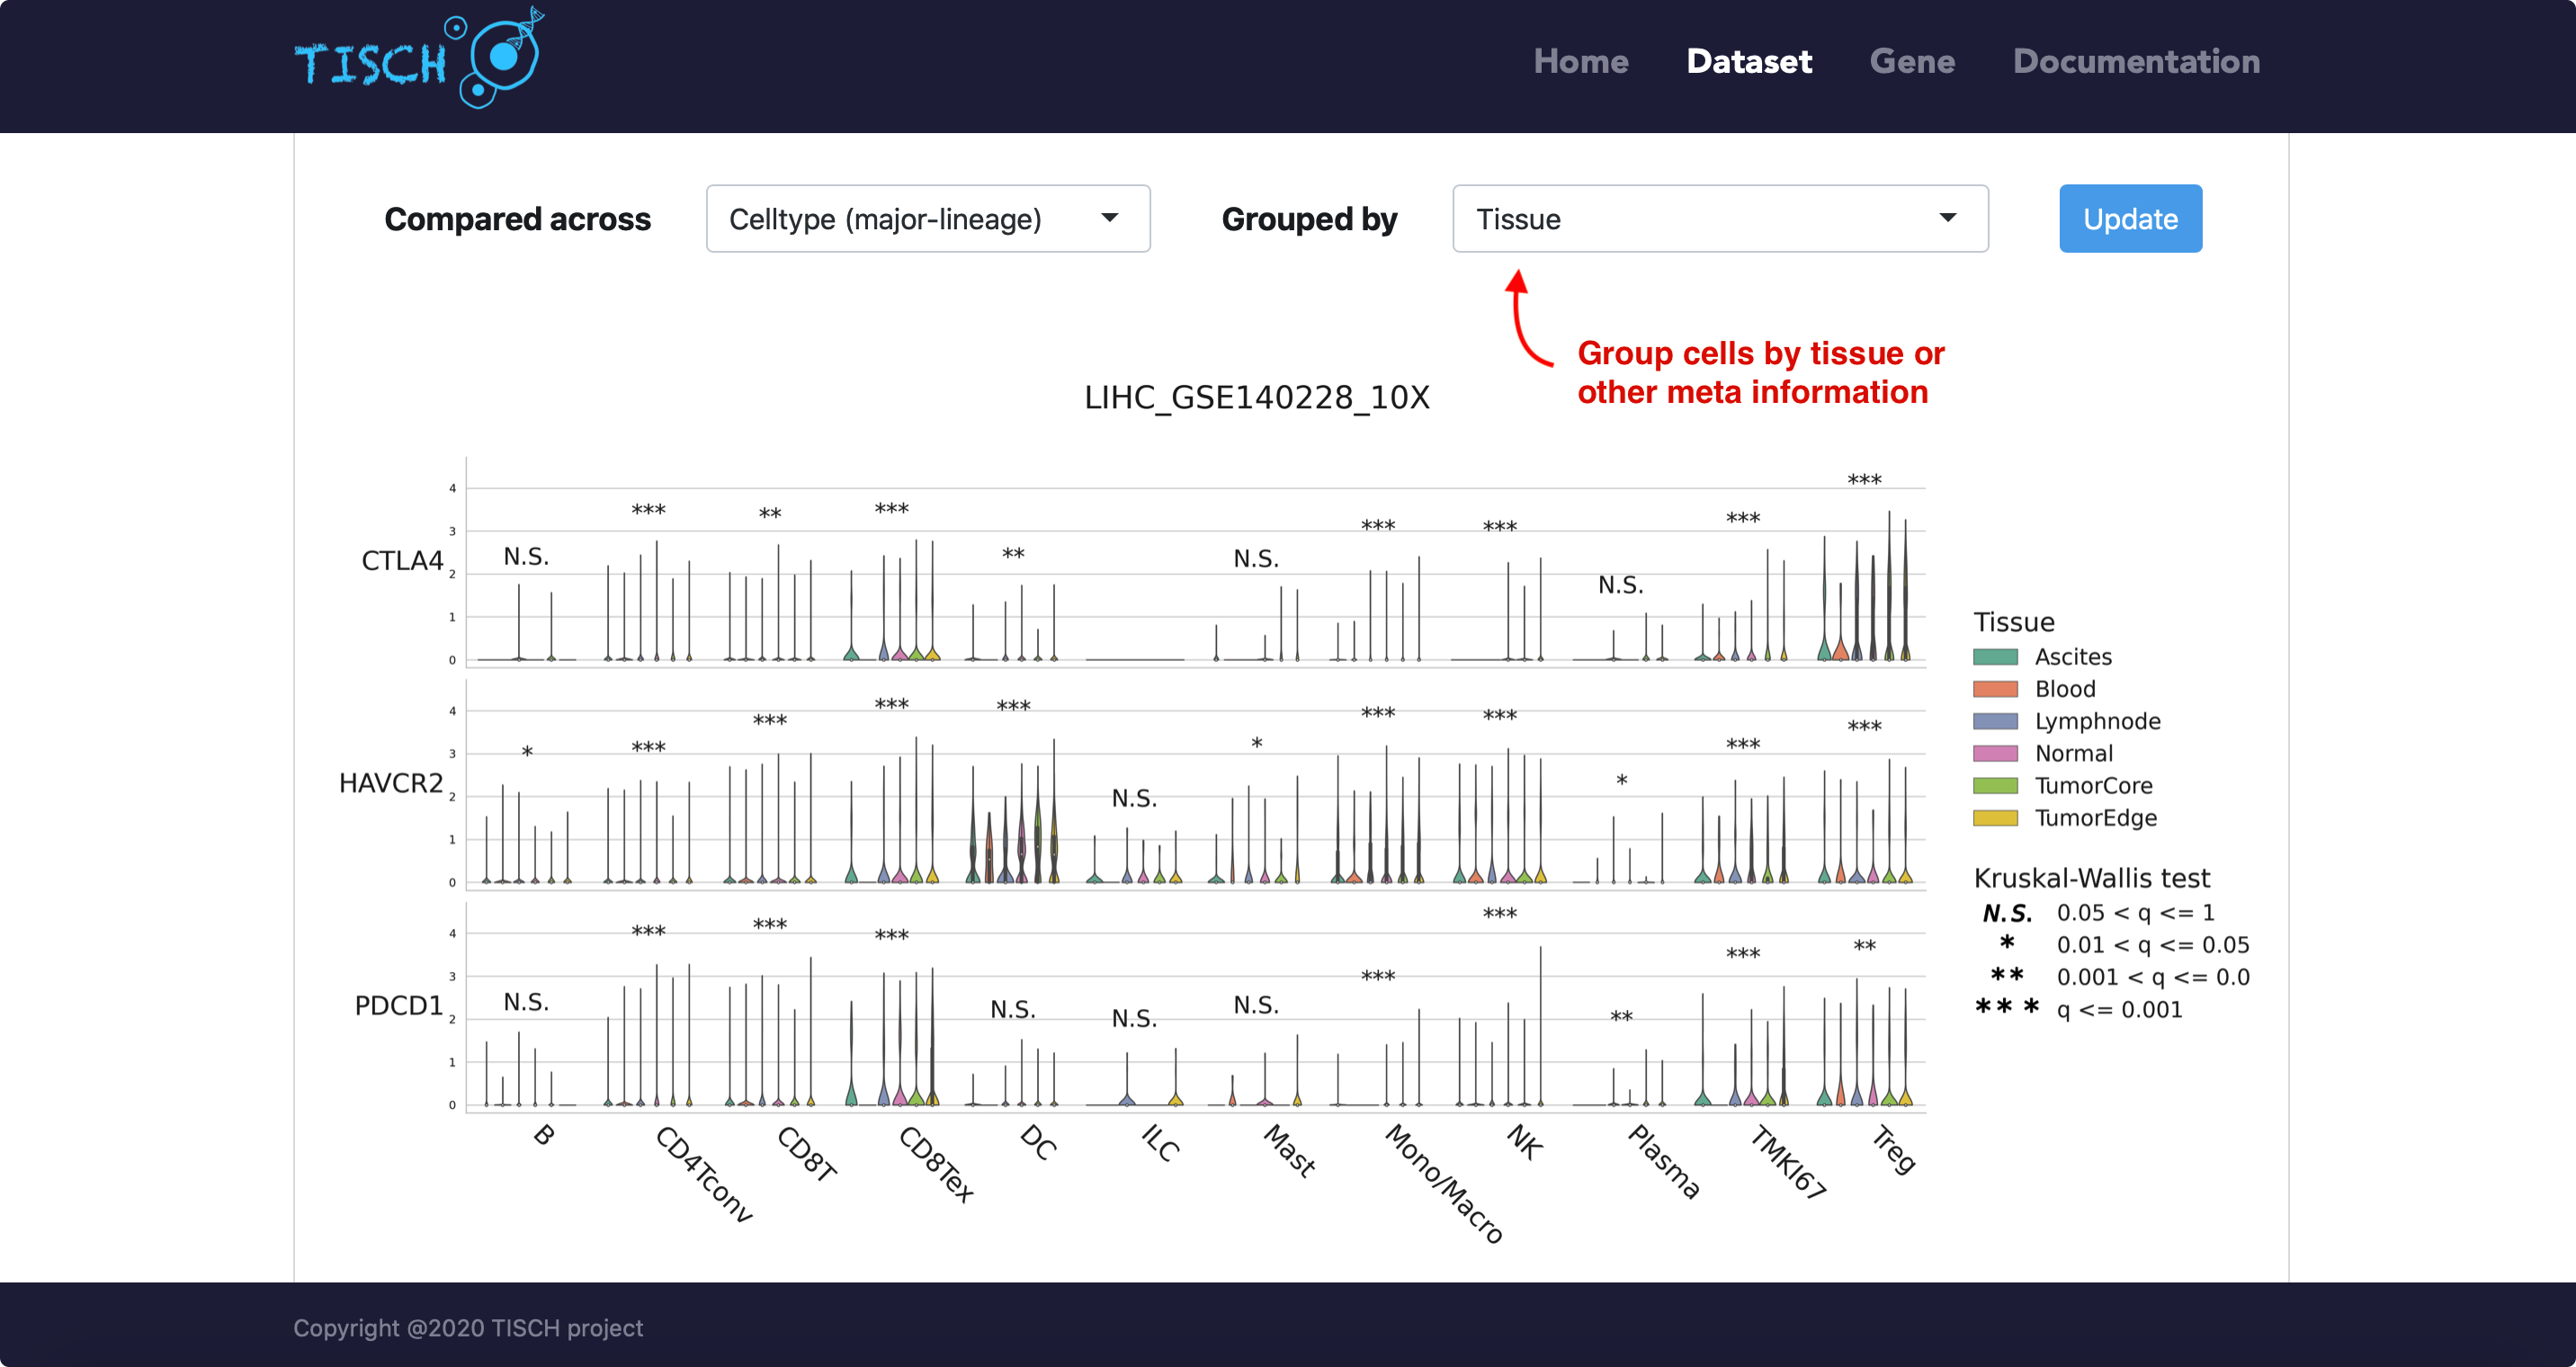
For the violin plot, users can choose to group cells by tissue origin or by other available meta information.
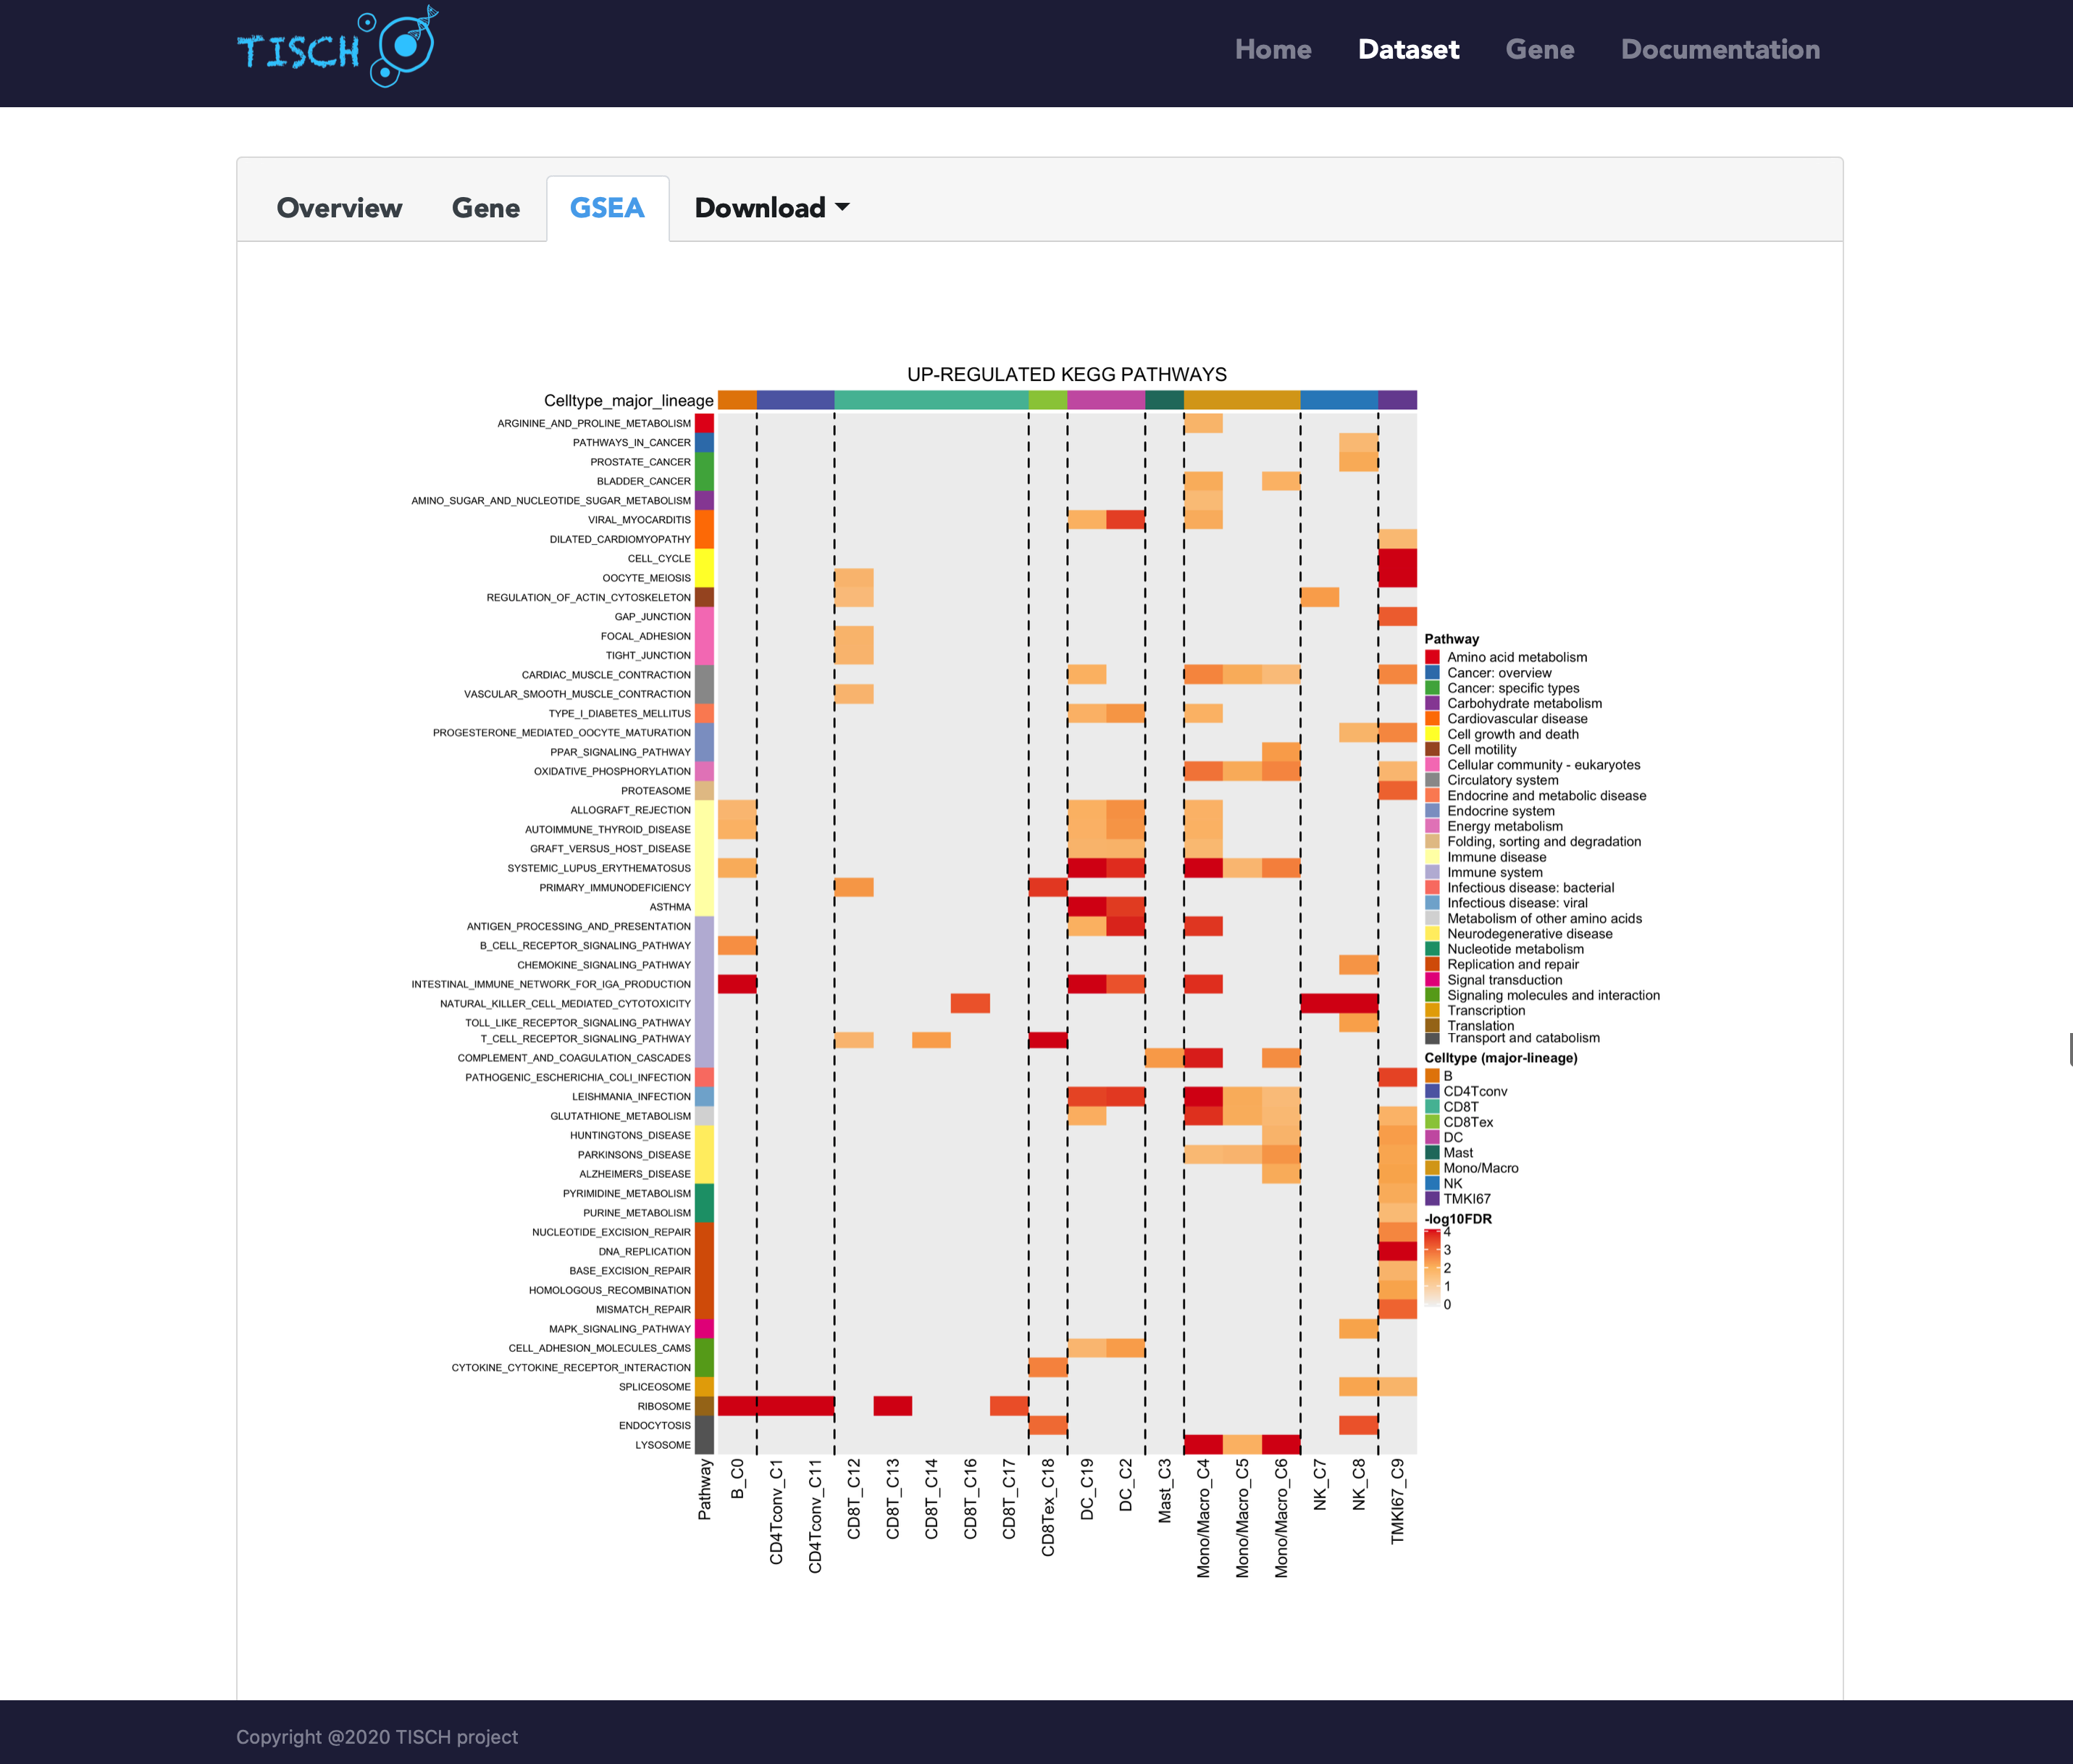
TISCH2 also provides the gene set enrichment analysis (GSEA) results for each dataset. In the GSEA tab, the KEGG pathway and HALLMARK pathway analysis are performed on the up/down-regulated genes, respectively.
Users can download the gene expresion matrix avaraged by cell types and differential gene table for further exploration.
Starting with a gene of interest
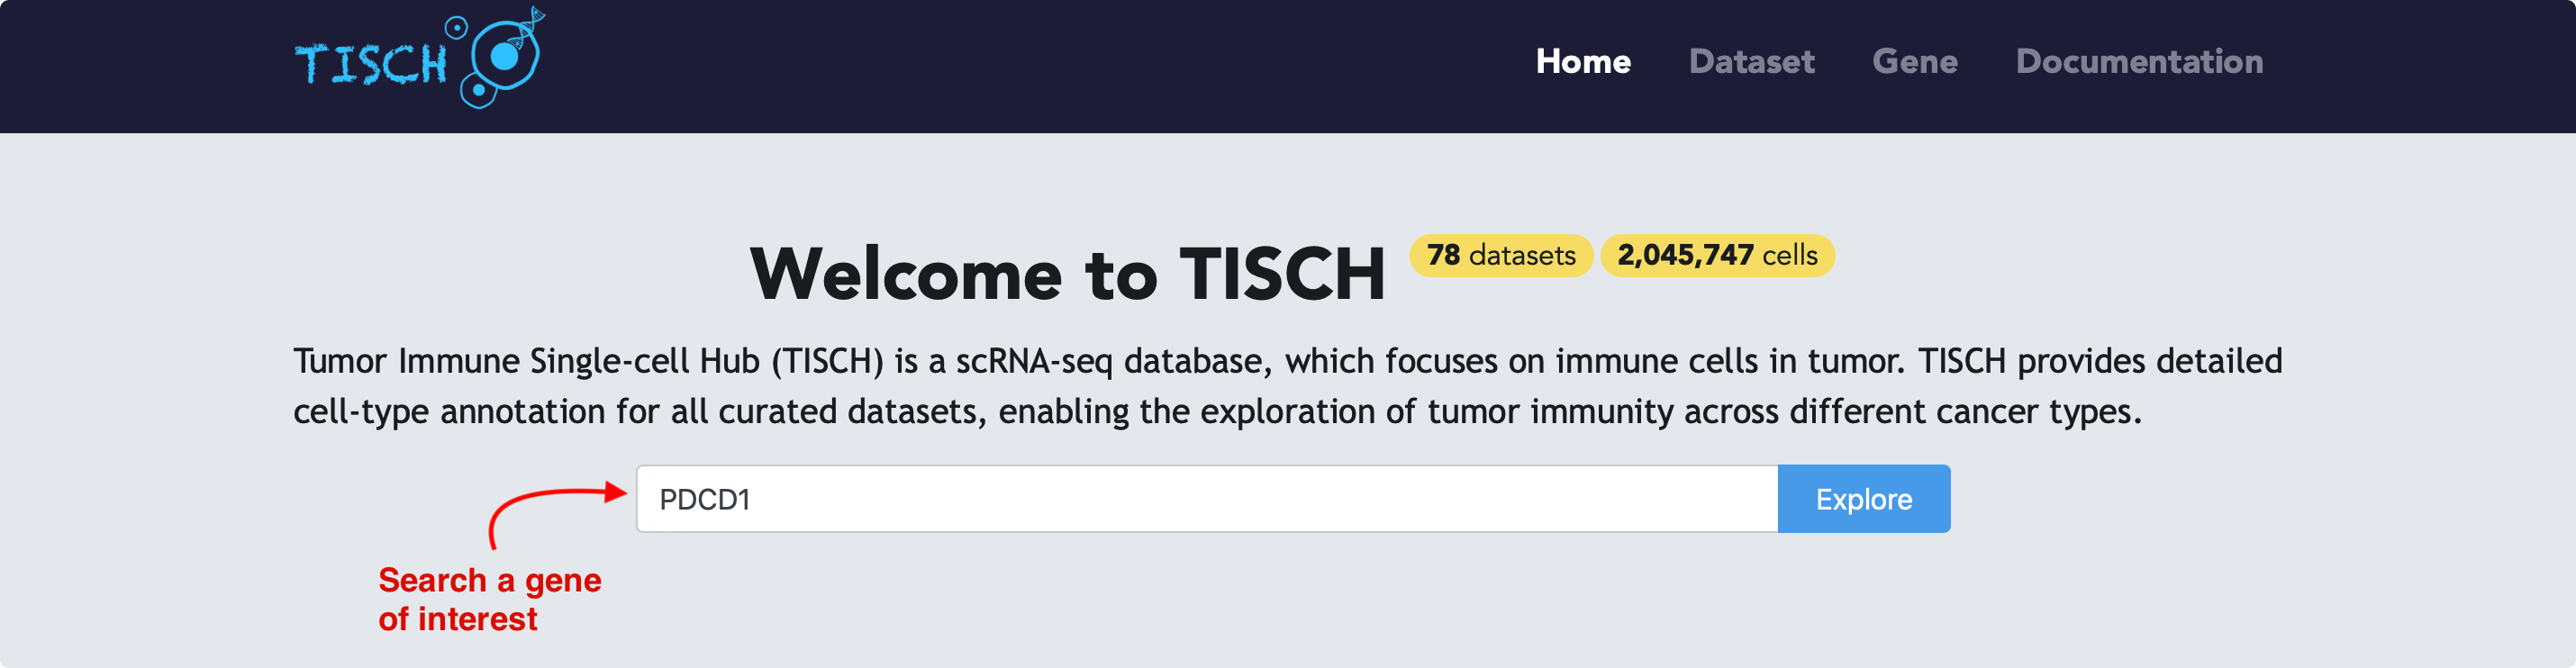
If users are interested in one gene, they can input the gene in the search bar and click the Explore button, then the page will be re-directed to gene page.
By default, the expression of the given gene will be visualized using all datasets with the gene expressed. Users can select the cancer types of interest to further filter the datasets.
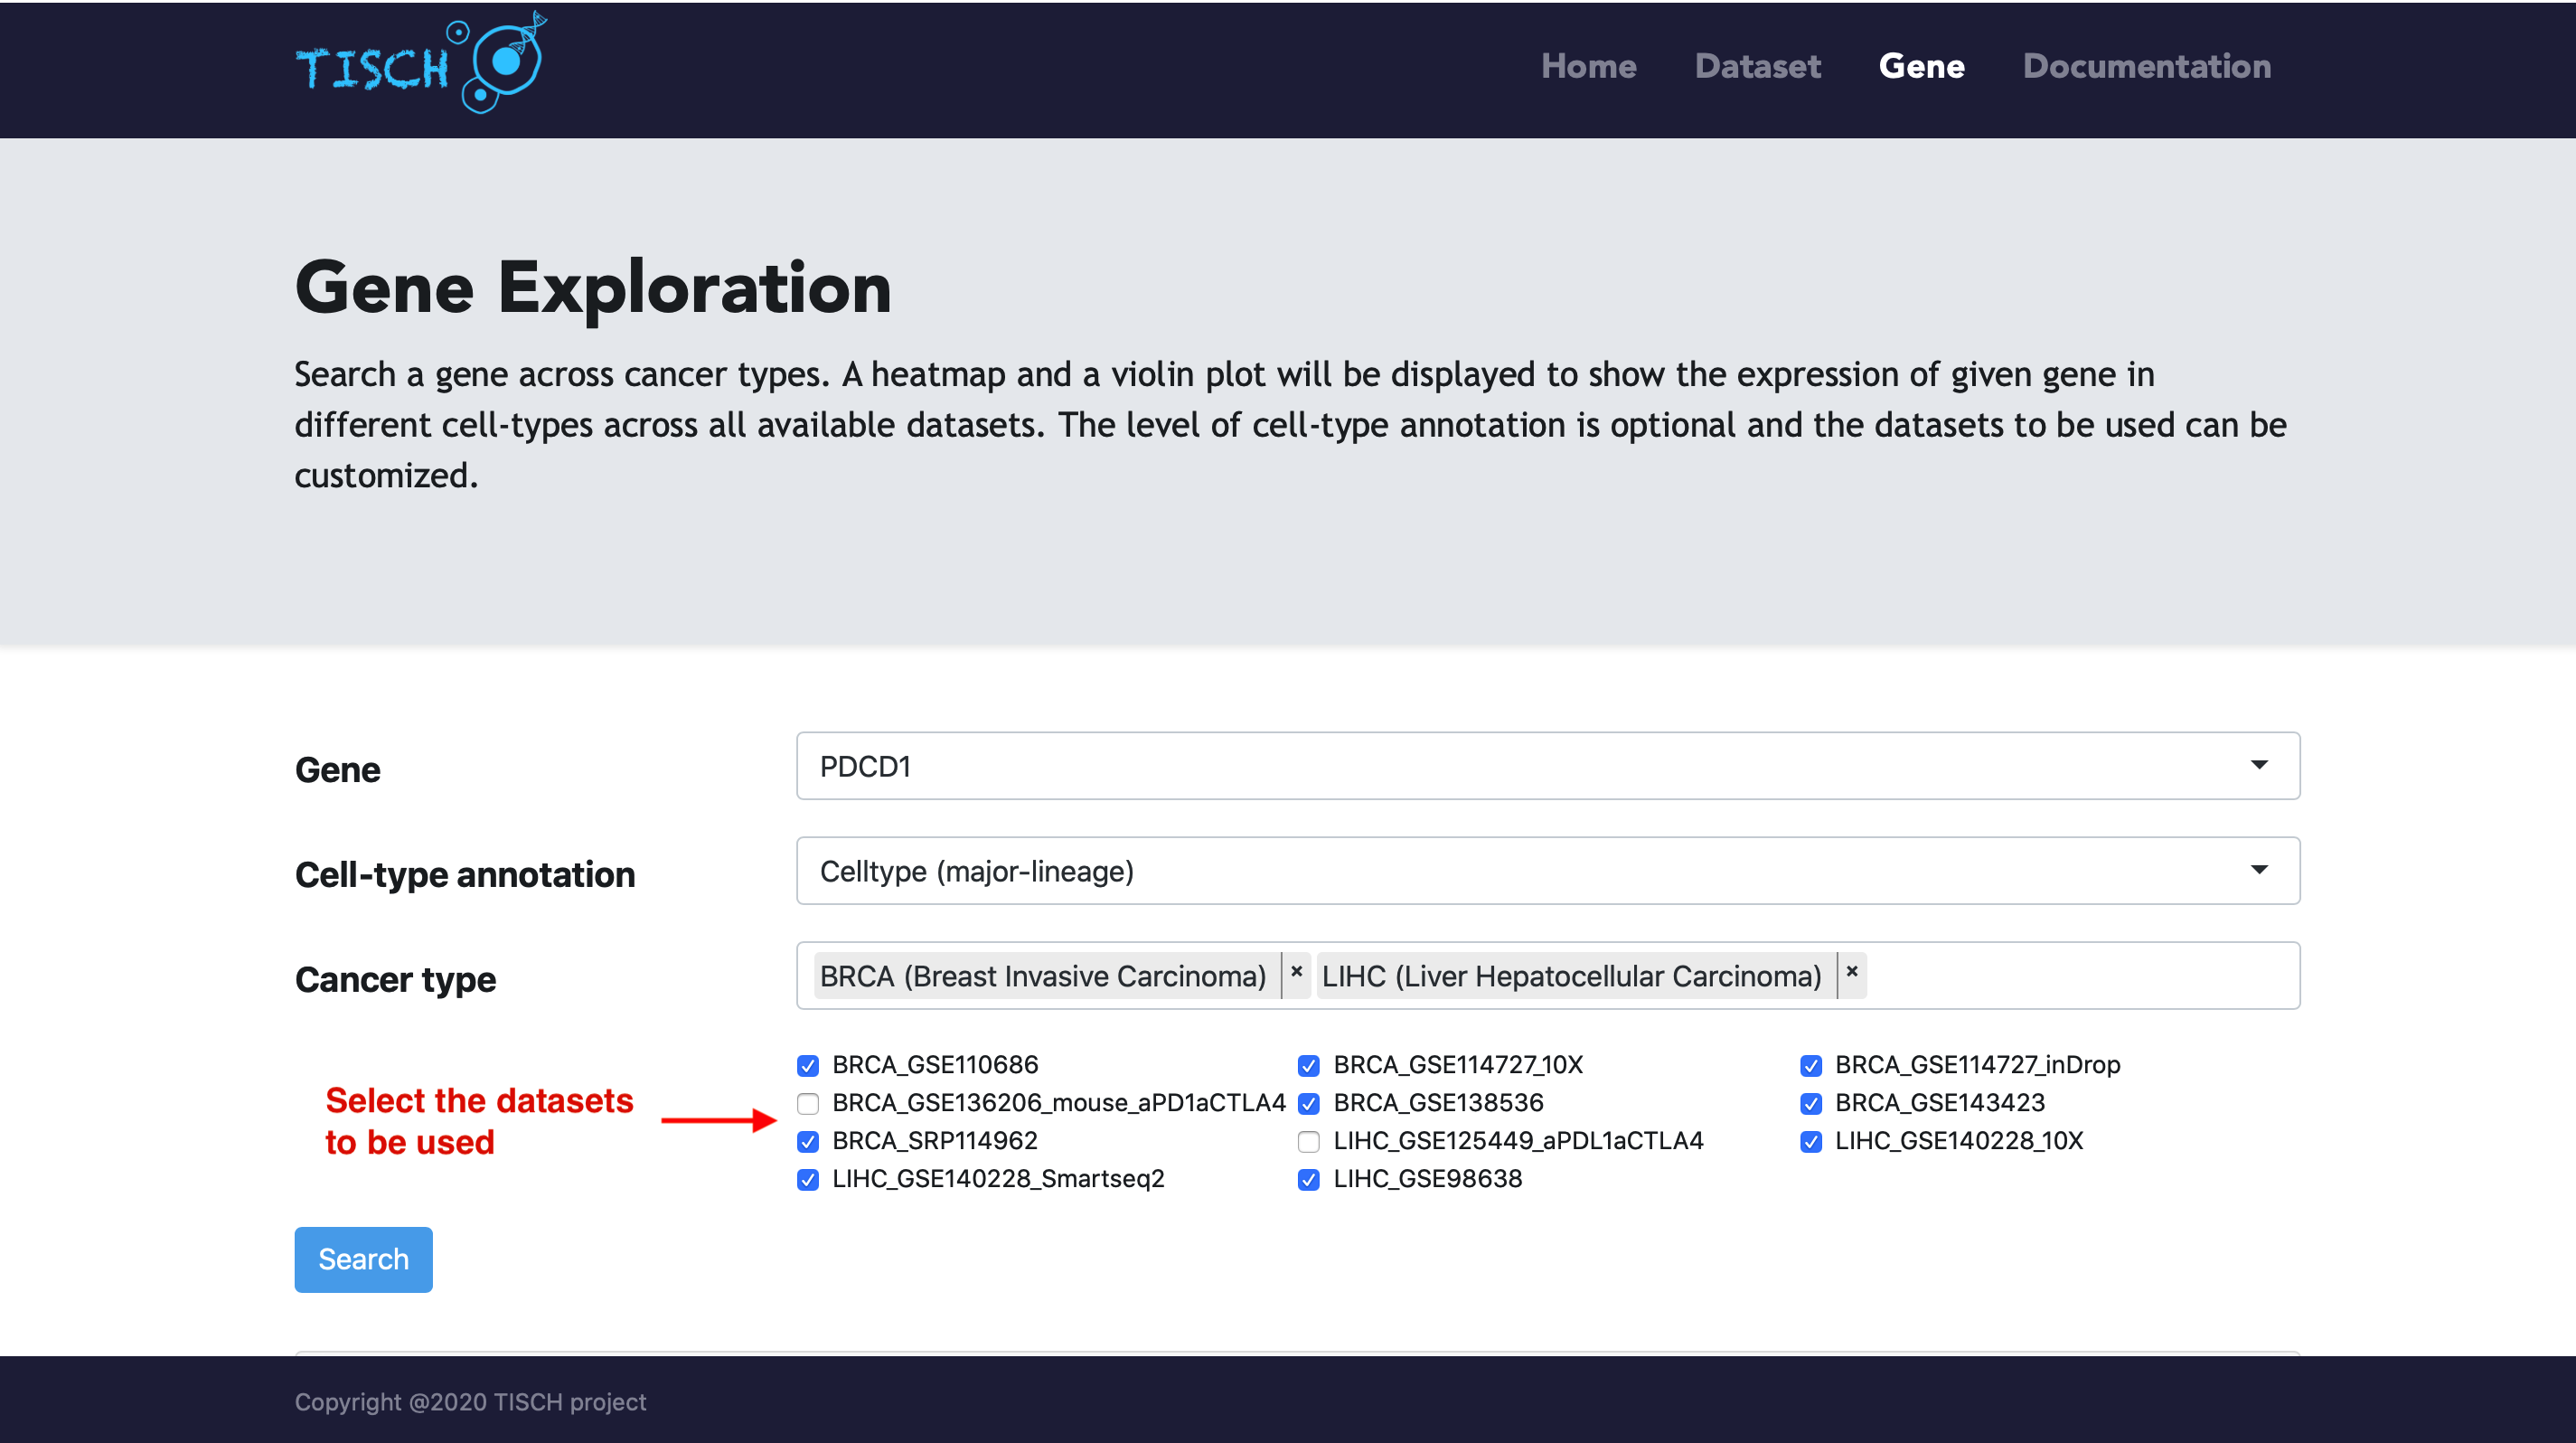
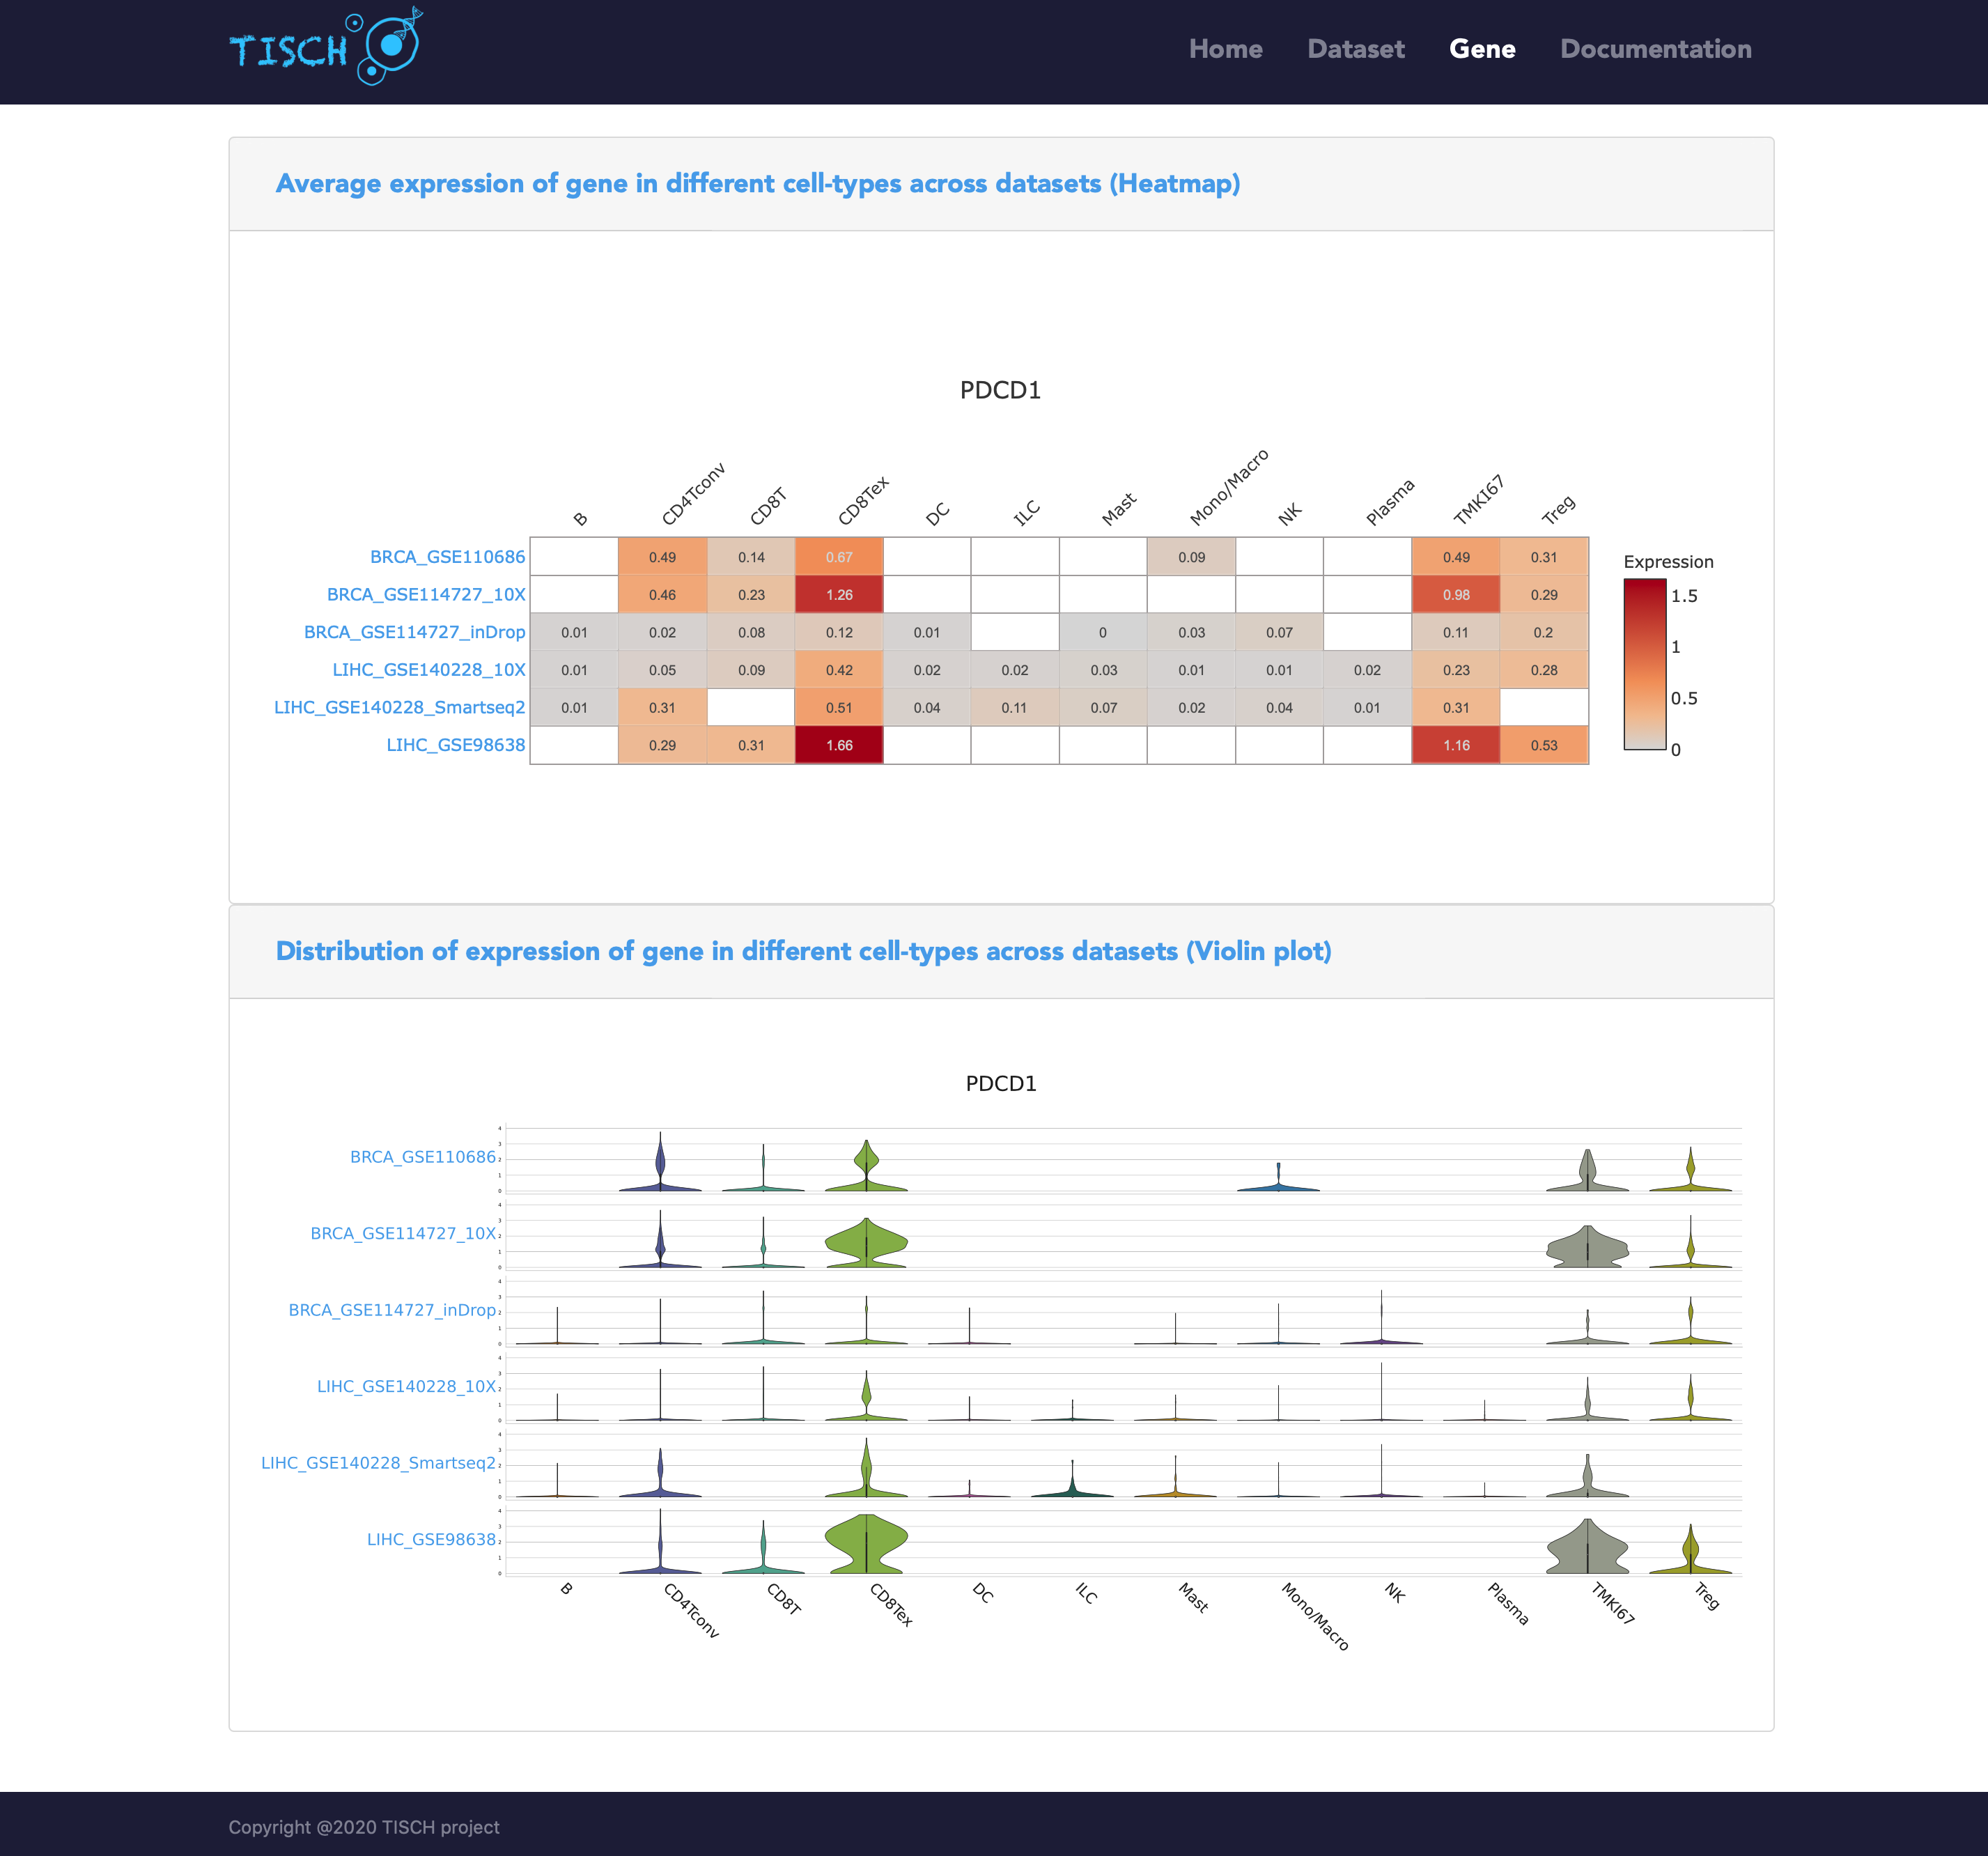
After clicking the Search button, a heatmap and a violin plot will be displayed to reflect the gene expression in different cell types across all the selected datasets.
Newly added functions
CCI
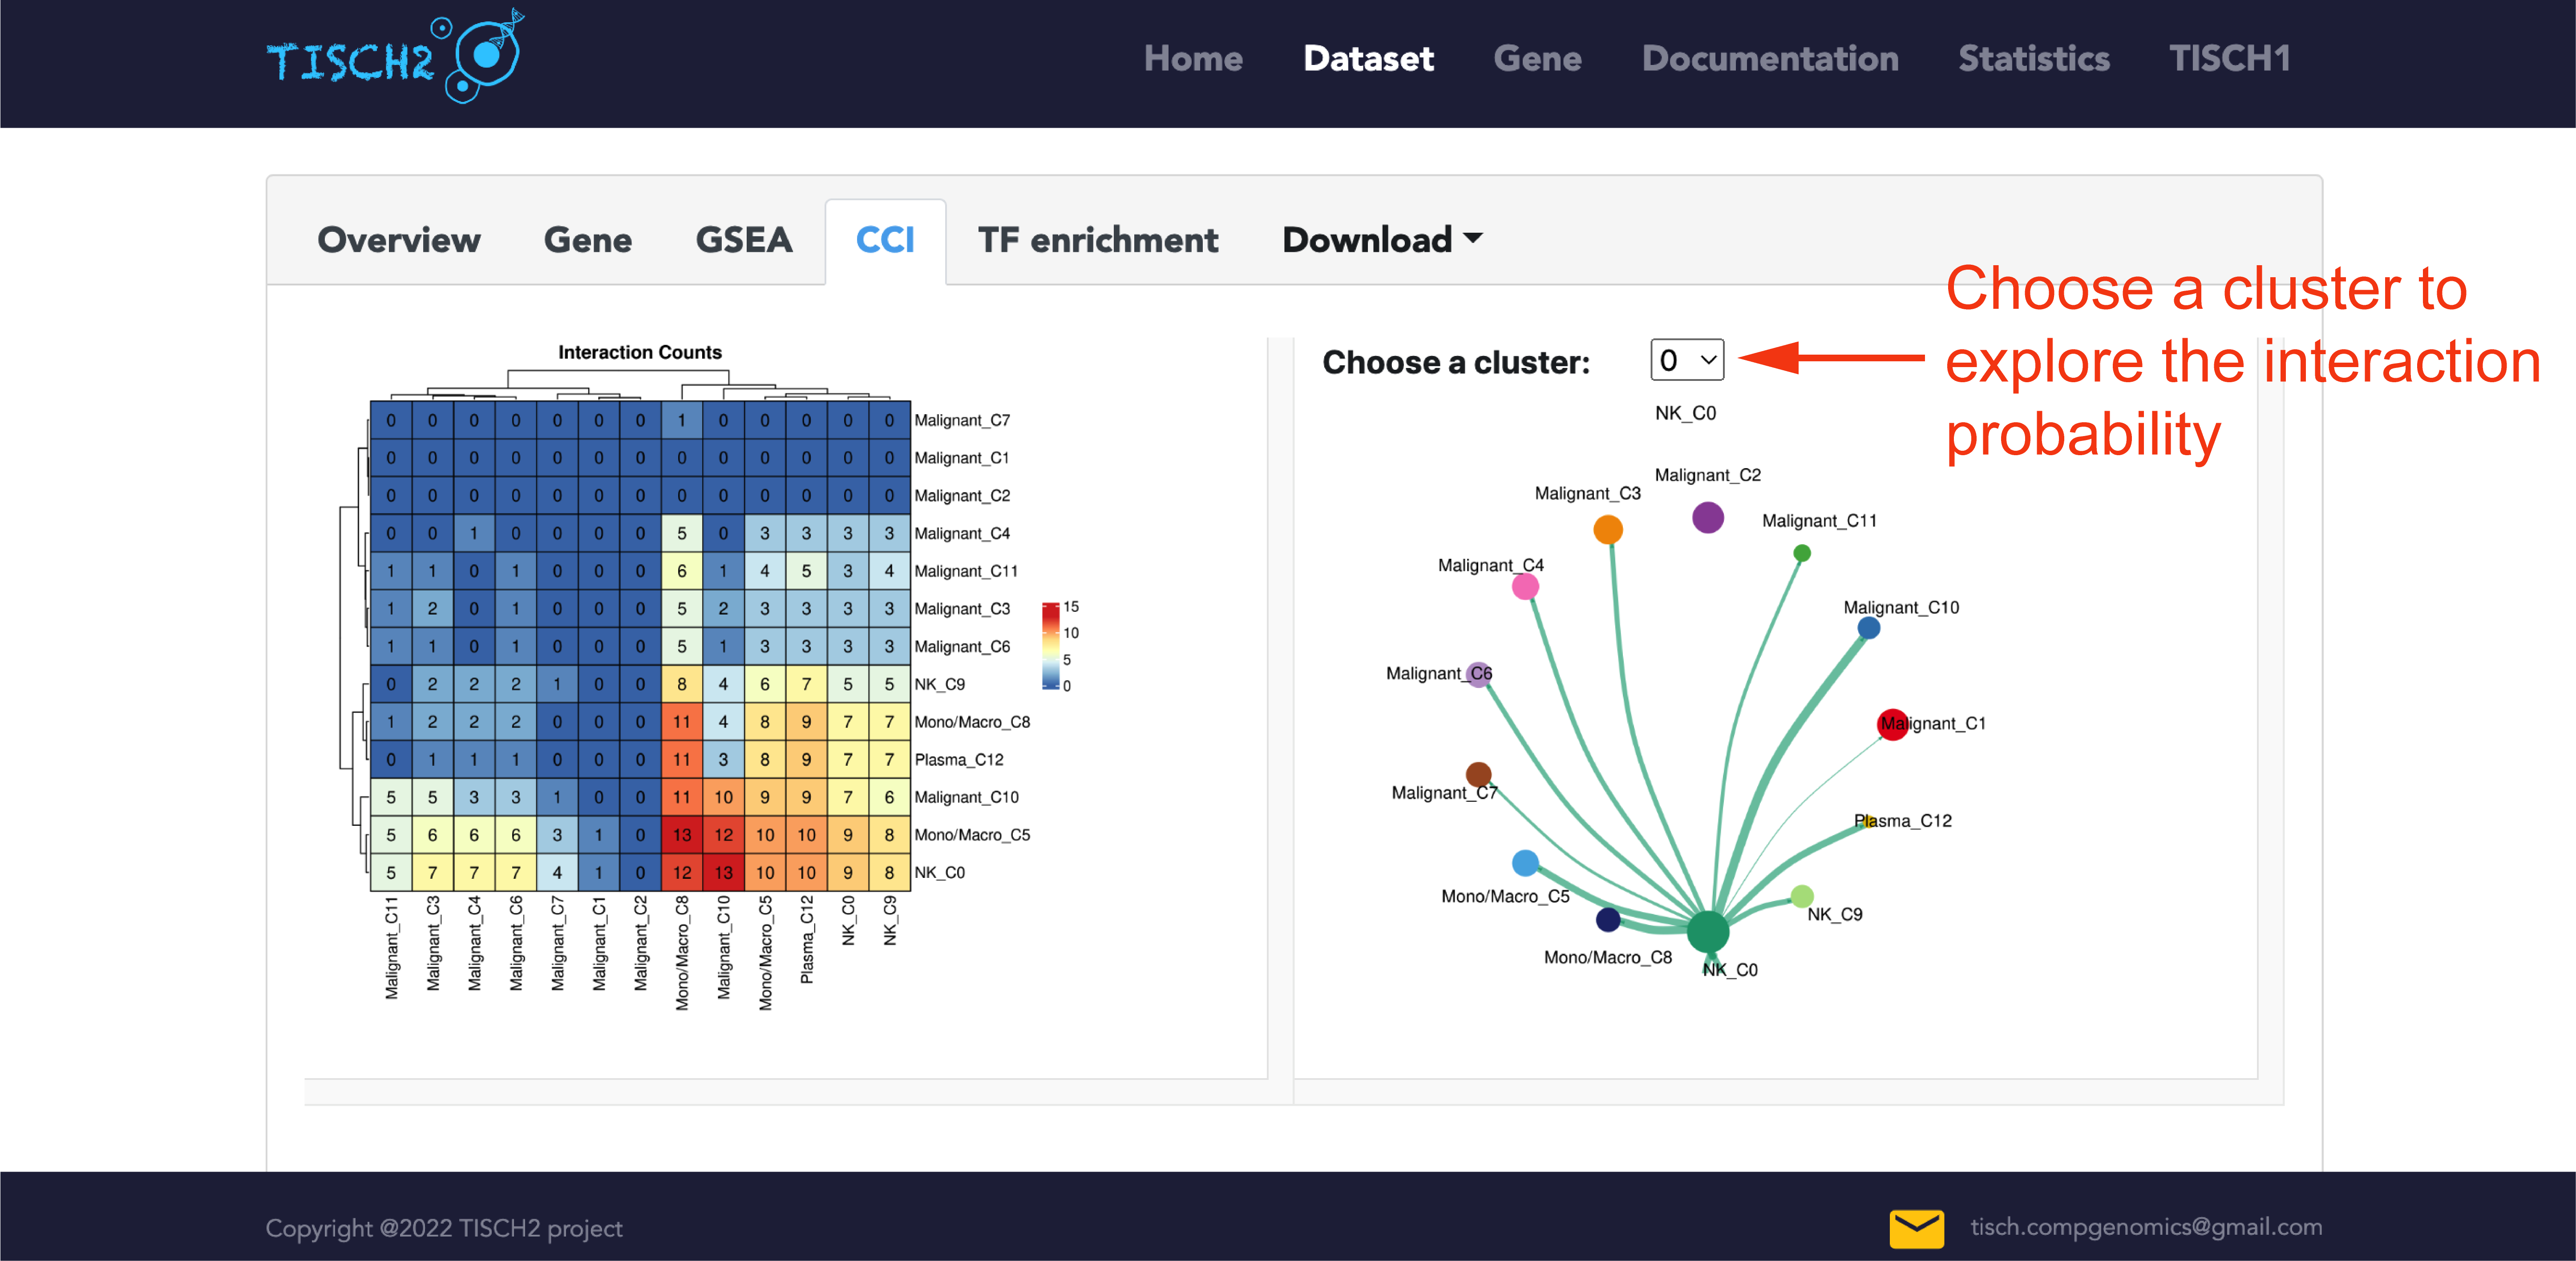
Understanding cell-cell interaction(CCI) among cells is critical for investigating how those cells and signals coordinate for functions. In the single-dataset page, TISCH2 integrated CellChat to infer the cell-cell communications between each cluster. In the CCI tab, the pre-calculated number of interaction count heatmap is available for users to overview communication between clusters. Users can optionally select a cluster of interest to visualize the number of significant ligand-receptor pairs. The edge width is proportional to the indicated number of ligand-receptor pairs.
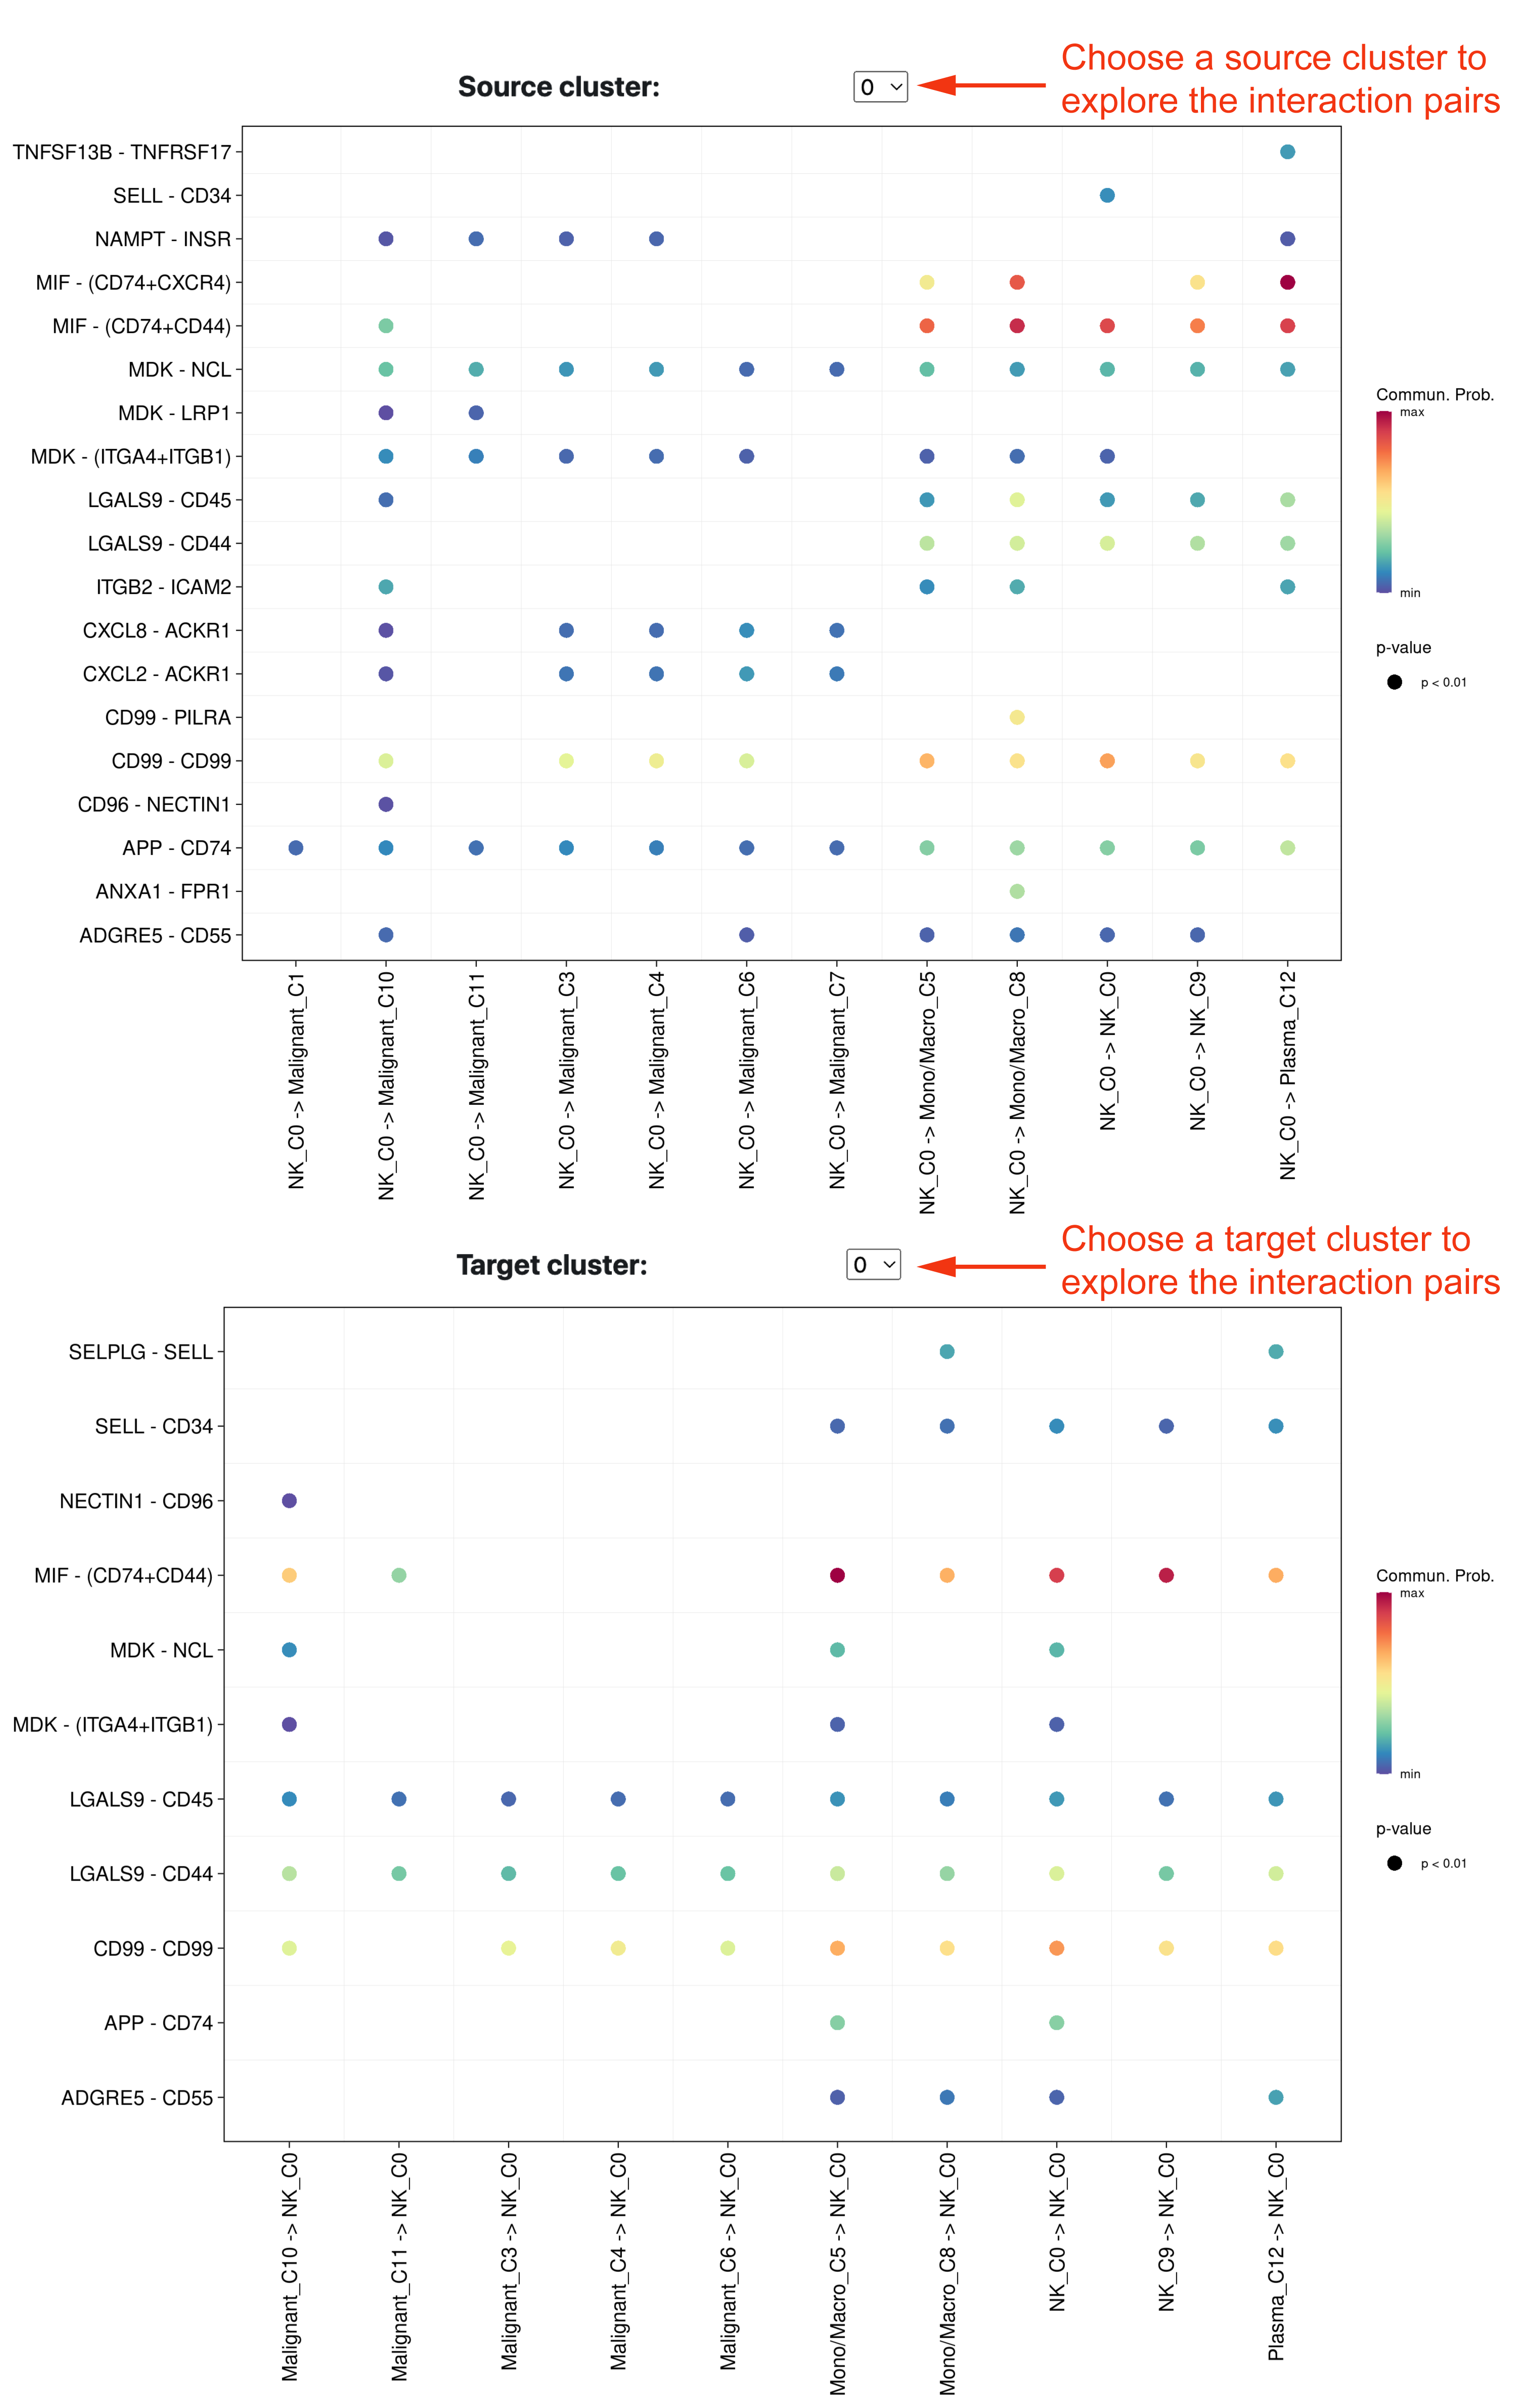
In addition, we also provide the detailed significant signaling pathways between two populations at the bottom of the CCI tab. Users could select the specific cluster representing source or target cells to visualize the significant ligand and receptor gene pairs.
TF enrichment
Identifying the transcriptional regulators which drive differential expression is crucial to understanding the underlying gene regulatory networks. In the single-dataset page, TISCH2 applies LISA to predict the transcriptional regulators that shape the expression patterns in different scRNA-seq clusters. In the TF enrichment tab, the heatmap shows the top TF enrichment in the dataset across different clusters. Users can optionally select a cluster of interest to visualize the rank of driver transcription regulators. The names of the top 10 TFs are labeled on the graph. To avoid the malignant cells bias, the dataset with many malignant cells, heatmap will be divided into 2 parts.
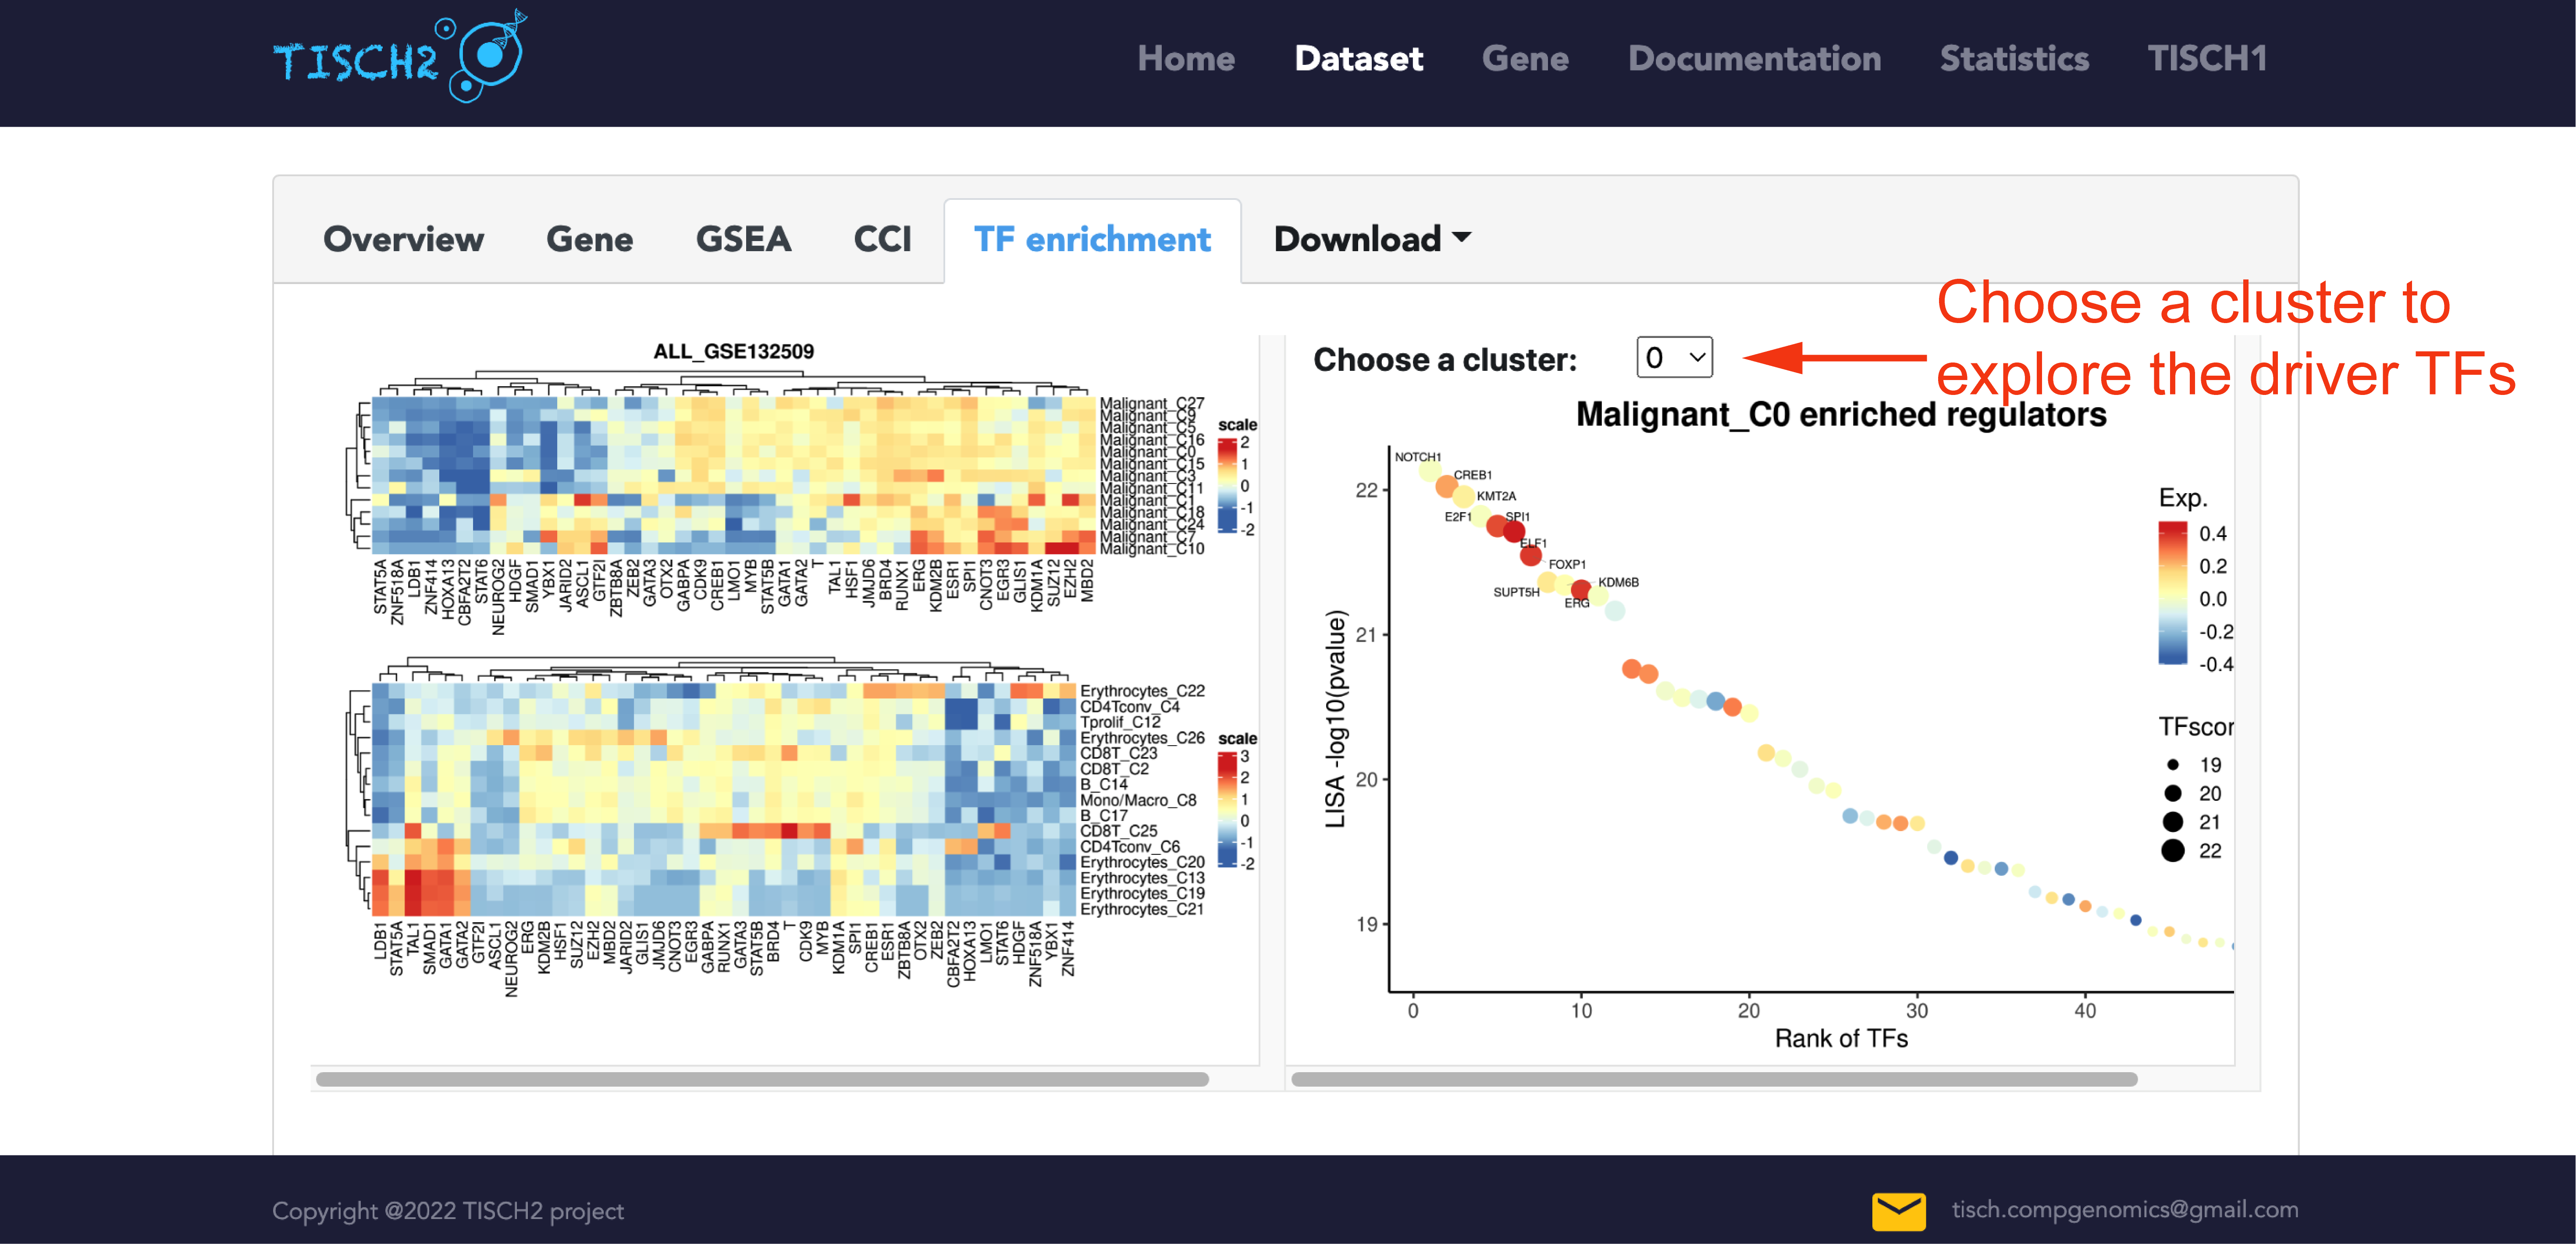
Users can download the top 100 TFs result table for further exploration.
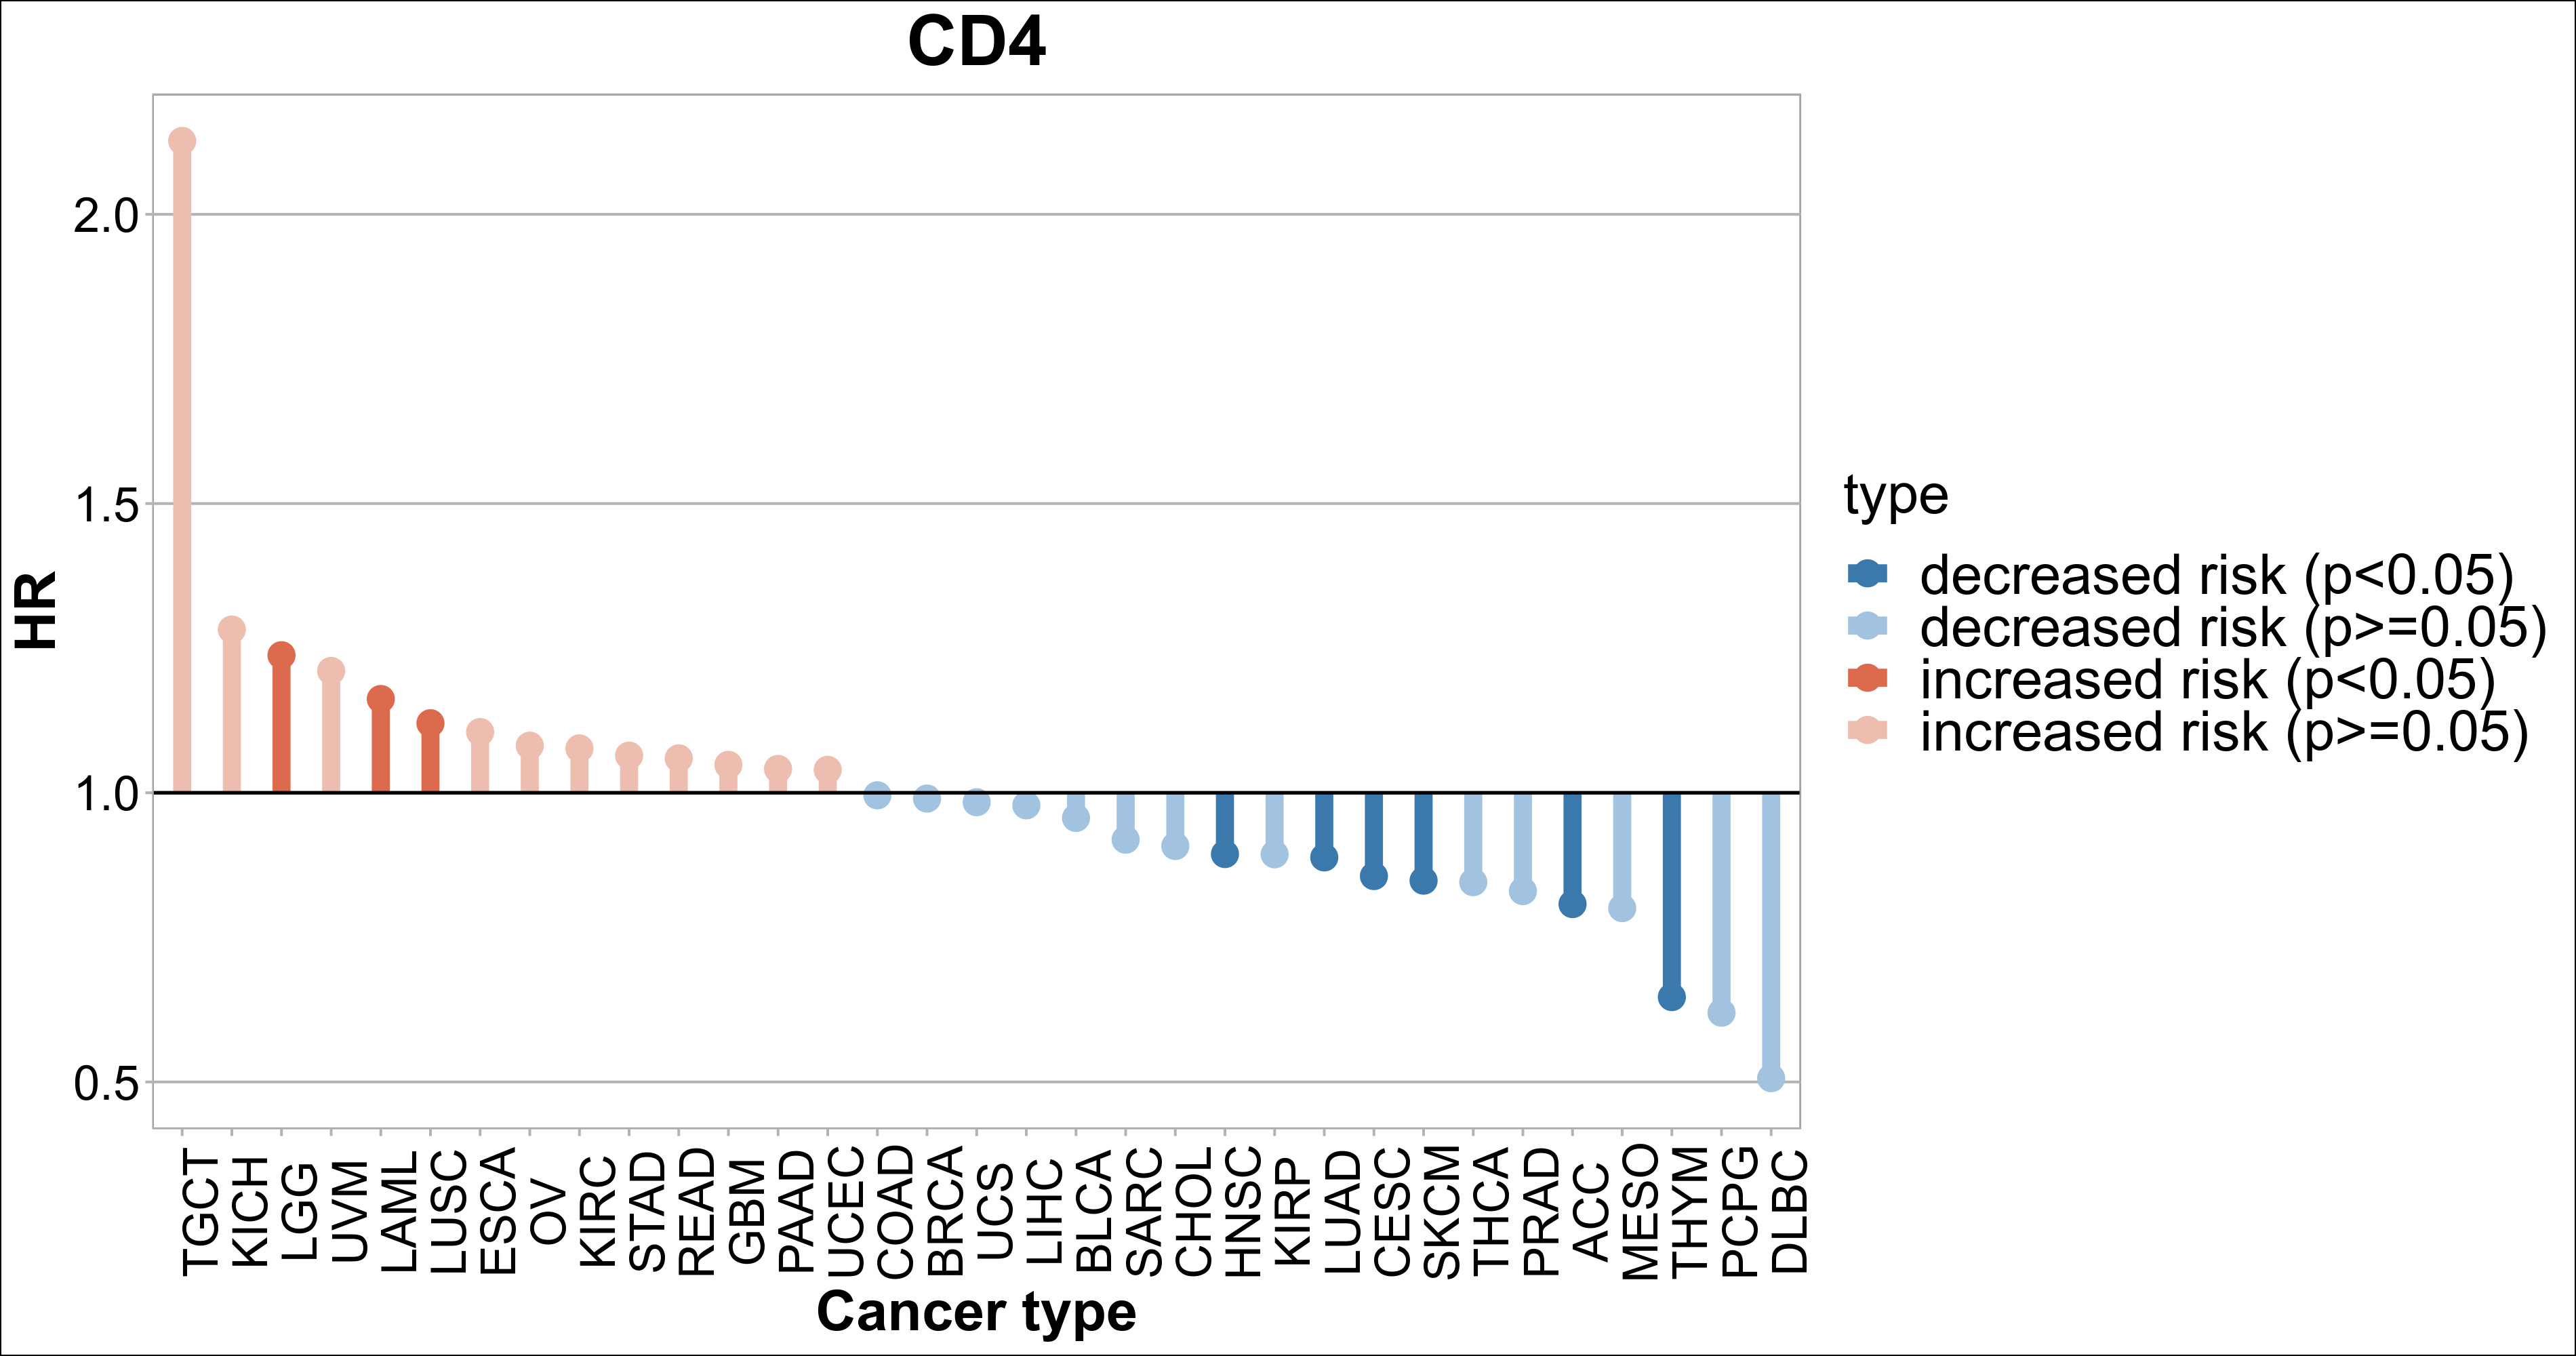
Survival
To facilitate the users to evaluate the clinical effect of the specific gene, we added the survival analysis in the Gene module. For a specific gene, we applied the Cox Proportional-Hazards Model and got the hazard ratio (HR) and p-value separately in TCGA 33 cancer types. If a gene’s HR was higher than one, suggested increased risk, while the gene’s HR lower than one was decreased risk.
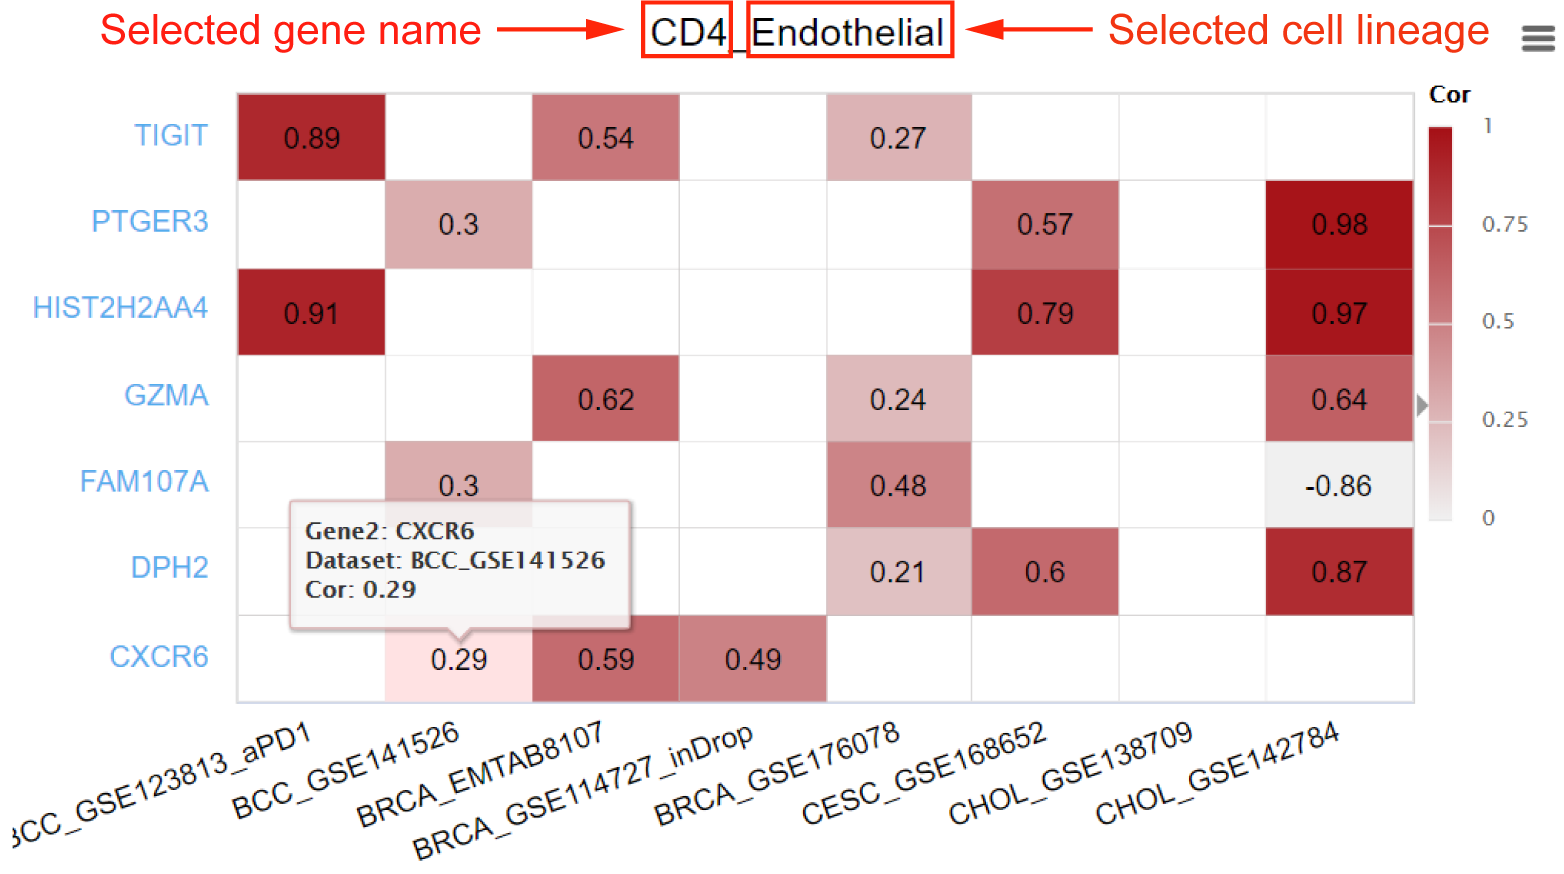
Gene-gene correlation
The Gene module added the gene-gene correlation analysis. Considering the diversity of gene expression patterns under different cell types, besides the global correlation, we also calculated the gene-gene correlation within specific cell lineages for each dataset. For each dataset, to reduce the noise and keep the rare cell type marker genes, we calculated the correlation between genes that average logTPM of more than 0.5 or max logTPM of more than 2.
In the gene correlation tab, TISCH2 provides a correlation result table of the input gene, including the top 500 correlated genes in different lineage conditions across the selected datasets. Users can select the datasets or lineages of interest to further filter the result. TISCH2 also provides a heatmap to visualize the top correlated genes that appear in more than half of the selected datasets, the maximum number of the gene that could be shown is 50.
Abbreviations
Cancer type
| Abbreviation | Cancer type |
|---|---|
| AEL | Acute Erythroid Leukemia |
| ALL | Acute Lymphoblastic Leukemia |
| AML | Acute Myeloid Leukemia |
| BCC | Basal Cell Carcinoma |
| BLCA | Bladder Urothelial Carcinoma |
| BRCA | Breast Invasive Carcinoma |
| CESC | Cervical Squamous Cell Carcinoma and Endocervical Adenocarcinoma |
| CHOL | Cholangiocarcinoma |
| CLL | Chronic Lymphocytic Leukemia |
| CRC | Colorectal Cancer |
| DLBC | Lymphoid Neoplasm Diffuse Large B-cell Lymphoma |
| ESCA | Esophageal Squamous Cell Aarcinoma |
| GCTB | Giant Cell Tumor of Bone |
| Glioma | Glioblastoma Multiforme |
| GIST | Gastrointestinal Stromal Tumor |
| HB | Hepatoblastoma |
| HNSC | Head and Neck Squamous Cell Carcinoma |
| KICH | Kidney Chromophobe |
| KIPAN | Pan-kidney Cancer |
| KIRC | Kidney Renal Clear Cell Carcinoma |
| LIHC | Liver Hepatocellular Carcinoma |
| LSCC | Laryngeal Squamous Cell Carcinoma |
| MB | Medulloblastoma |
| MCC | Merkel Cell Carcinoma |
| MF | Mycosis Fungoides |
| MM | Multiple Myeloma |
| MPNST | Malignant Peripheral Nerve Sheath Tumor |
| NB | Neuroblastoma |
| Neurofibroma | Neurofibroma |
| NET | Neuroendocrine Tumor |
| NHL | Non-Hodgkin Lymphoma |
| NPC | Nasopharyngeal Carcinoma |
| NSCLC | Non-small Cell Lung Cancer |
| OS | Osteosarcoma |
| OSCC | Oral Squamous Cell Carcinoma |
| OV | Ovarian Serous Cystadenocarcinoma |
| PAAD | Pancreatic Adenocarcinoma |
| PCFCL | Primary Cutaneous Follicle Center Lymphoma |
| PPB | Pleuropulmonary Blastoma |
| PRAD | Prostate Adenocarcinoma |
| RB | Retinoblastoma |
| SARC | Sarcoma |
| SCC | Squamous Cell Carcinoma |
| SCLC | Small Cell Lung Cancer |
| SKCM | Skin Cutaneous Melanoma |
| SS | Synovial Sarcoma |
| STAD | Stomach Adenocarcinoma |
| THCA | Thyroid Carcinoma |
| UCEC | Uterine Corpus Endometrial Carcinoma |
| UVM | Uveal Melanoma |
Cell type
| Abbreviation | Cell type |
|---|---|
| AC-like Malignant | Astrocyte-like Malignant Cells |
| Acinar | Acinar Cells |
| Alveolar | Alveolar Cells |
| Amacrine | Amacrine Cells |
| Astrocyte | Astrocytes |
| Basal | Basal Cells |
| B | B Cells |
| CD4T | CD4 T Cells |
| CD4Tconv | Conventional CD4 T Cells |
| CD8T | CD8 T Cells |
| CD8Tex | Exhausted CD8 T Cells |
| Cholangiocytes | Cholangiocytes |
| Ciliated | Ciliated Epithelial Cells |
| Club | Club Cells |
| Cones | Cone Cells |
| DC | Dendritic Cells |
| Ductal | Ductal Cells |
| Endocrine | Endocrine Cells |
| Endothelial | Endothelial Cells |
| EGCs | Enteric Glial Cells |
| Epithelial | Epithelial Cells |
| EryPro | Erythroid Progenitor Cells |
| Erythroblasts | Erythroblasts |
| Erythrocytes | Erythrocytes |
| ESCs | Endometrial Stromal Cells |
| Fibroblasts | Fibroblasts |
| Gland | Gland Cells |
| Gland mucous | Gland Mucous Cells |
| GMP | Granulocyte-macrophage Progenitor Cells |
| Goblet | Goblet Cells |
| Hepatic progenitor | Hepatic progenitor Cells |
| Hepatocytes | Hepatocytes |
| HCs | Horizontal Cells |
| HSC | Hematopoietic Stem Cells |
| ILC | Innate Lymphoid Cells |
| Keratinocytes | Keratinocytes |
| Kupffer | Kupffer Cells |
| Malignant | Malignant Cells |
| Mast | Mast Cells |
| Melanocytes | Melanocytes |
| MES-like Malignant | Mesenchymal-like Malignant Cells |
| Microglia | Microglia Cells |
| Mono/Macro | Monocytes or Macrophages |
| Muller Glia | Muller Glia Cells |
| Mural | Mural Cells |
| Myocyte | Myocytes |
| Myofibroblasts | Myofibroblasts |
| NB-like Malignant | Neuroblast-like Malignant Cells |
| Neural Crest | Neural Crest Cells |
| Neuron | Neurons |
| Neutrophils | Neutrophils |
| NK | Natural Killer Cells |
| NKT | Natural Killer T Cells |
| NPC-like Malignant | Neural-progenitor-like Malignant Cells |
| OC-like Malignant | Oligodendrocyte-like Malignant Cells |
| Oligodendrocyte | Oligodendrocytes |
| OPC | Oligodendrocyte Precursor Cells |
| OPC-like Malignant | Oligodendrocyte-precursor-cell-like Malignant Cells |
| Osteoblasts | Osteoblasts |
| Others | Other Cells |
| pDC | Plasmacytoid Dendritic Cells |
| Pericytes | Pericytes |
| Photoreceptor | Photoreceptor Cells |
| Pit mucous | Pit Mucous Cells |
| Plasma | Plasma Cells |
| Progenitor | Progenitor Cells |
| Promonocyte | Promonocytes |
| Retinal | Retinal Cells |
| Schwann | Schwann Cells |
| Secretory glandular | Secretory Glandular Cells |
| SMC | Smooth Muscle Cells |
| Stellate | Stellate Cells |
| Tprolif | Proliferating T Cells |
| Treg | Regulatory T Cells |
| Vascular | Vascular Cells |
ICB associated signatures
| SignatureID | GeneSymbol | PMID | Signature Cite | Journal Info | Description |
|---|---|---|---|---|---|
| TLS | BCL6, CCL19, CCL21, CCR7, CD86, CXCL13, CXCR4, LAMP3, SELL | 32238929 | TLS, Cabrita R, 2020 | Nature 2020 | Tertiary lymphoid structures |
| TLS-melanoma | CCR6, CD1D, CD79B, CETP, EIF1AY, LAT, PTGDS, RBP5, SKAP1 | 32238929 | TLS-melanoma,Cabrita R, 2020 | Nature 2020 | Transport Layer Security |
| T cell-inflamed | CCL5, CD27, CD274, CD276, CD8A, CMKLR1, CXCL9, CXCR6, HLA-DQA1, HLA-DRB1, HLA-E, IDO1, LAG3, NKG7, PDCD1LG2, PSMB10, STAT1, TIGTT | 28650338 | T cell-inflamed GEP, Ayers M, 2017 | J Clin Invest. 2017 | T-cell-inflamed gene-expression profile |
| IFNG | CXCL10, CXCL9, HLA-DRA, IDO1, IFNG, STAT1 | 30127393 | IFNG, Jiang P, 2018 | Nat Med. 2018 | IFNG |
| Checkpoint | PDCD1, CTLA4, TIGIT, TNFRSF9, C10orf54, HAVCR2, LAG3, BTLA | 30449619 | Checkpoint, Shifrut, 2018 | Cell. 2018 | Immune checkpoint |
| IMPRES |
PDCD1, OX40L, CD27, CTLA4, CD40, CD28, CD86, CD80, CD137L, CD274, VISTA, HAVCR2, CD200, CD276, HVEM
|
30127394 | IMPRES, Auslander, 2018 | Nat Med. 2018 | Immuno-predictive score |
| IPRES | ANGPT2, AXL, CCL13, CCL2, CCL7, CDH1, FAP, FLT1, IL10, LOXL2, RORA, RORB, RORC, TAGLN, TWIST2, VEGFA, VEGFC, WNT5A | 26997480 | IPRES, Hugo, 2016 | Cell. 2016 | Innate anti-PD-1 resistance |
| Inflammatory | CCL5, CCR5, CD274, CD3D, CD3E, CD8A, CIITA, CTLA4, CXCL10, CXCL11, CXCL13, CXCL9, GZMA, GZMB, HLA-DRA, HLA-DRB1, HLA-E, IDO1, IL2RG, ITGAL, LAG3, NKG7, PDCD1, PRF1, PTPRC, STAT1, TAGAP | 31683225 | Inflammatory, Thompson, 2020 | Lung Cancer. 2020 | Inflammatory |
| CTL | CD8A, CD8B, GZMA, GZMB, PRF1 | 30127393 | IFNG, Jiang P, 2018 | Nat Med. 2018 | Cytotoxic T lymphocyte |
| T-quiescent | KLF2, TCF7, S1PR1, LEF1, IL7R, CD27, SELL, CD3D, CD3E | 33303615 | T persistence, Sri Krishana, 2020 | Science. 2020 | TIL persistence |
FAQ (Frequently Asked Questions)
Citation
1. How to cite TISCH?
Ya Han, Yuting Wang, Xin Dong, Dongqing Sun, Zhaoyang Liu, Jiali Yue, Haiyun Wang, Taiwen Li, Chenfei Wang, TISCH2: expanded datasets and new tools for single-cell transcriptome analyses of the tumor microenvironment, Nucleic Acids Research, gkac959, https://doi.org/10.1093/nar/gkac959
Dongqing Sun, Jin Wang, Ya Han, Xin Dong, Jun Ge, Rongbin Zheng, Xiaoying Shi, Binbin Wang, Ziyi Li, Pengfei Ren, Liangdong Sun, Yilv Yan, Peng Zhang, Fan Zhang, Taiwen Li, Chenfei Wang, TISCH: a comprehensive web resource enabling interactive single-cell transcriptome visualization of tumor microenvironment, Nucleic Acids Research, gkaa1020, https://doi.org/10.1093/nar/gkaa1020
Experession value
1. What's the units of the downloadable single-cell level expression matrices?
The values in the single-cell level expression matrix are normalized. We employed the global-scaling normalization method ('NormalizeData' function) in Seurat to scale the raw counts (UMI) in each cell to 10,000, and then log-transformed the results. And also, the gene expression level displayed using UMAP and violin plots in the Dataset page is quantified by the normalized values.
2. How to understand the values in the heatmaps and the violin plots of Gene page?
Firstly, in the Gene page, we converted raw count or FPKM, which depends on the available data, to TPM to ensure the expression level is relatively comparable between different datasets. The expression of a gene in the cell was quantified as log2(TPM/10+1). TPM values were divided by 10 to lower the impact of varying dropout rates between genes. Secondly, the values in the heatmap are mean expression values of the gene in different cell types of different datasets. And the mean values are the original ones in their own datasets, which means we didn't perform any normalization across multiple datasets.
Cell-type annotation
1. How did TISCH annotate the cell types?
The clusters of malignant cells were determined by combining three approaches. First, we took the cell-type annotations provided by the original studies. Second, we checked the malignant cell makers’ expression distribution from the initial research, such as epithelial markers, EMT genes, if available. Third, we ran InferCNV to predict cell malignancy based on the predicted copy number variation and separated the cells into malignant and non-malignant clusters. For the other normal clusters, we automatically annotated the cell clusters with a marker-based annotation method employed in MAESTRO using the DE genes between clusters, and then manually corrected the cell-type annotation results according to the cell-type annotations provided by the original studies. Please see the paper for more details.
Download
1. Is there a way to download all datasets in a batch?
Unfortunately, TISCH doesn't provide such a batch download function considering the bandwidth of the network.
2. How to download the pictures of high resolution in TISCH?
In the Dataset page, all the pictures can be saved to the local disk by right-clicking the image. In the Gene page, the heatmap can be downloaded by clicking the button at the top right corner. The violin plot in the Gene page can also be downloaded by right-clicking and selecting 'Save link as'.